
SEO Client Report Template: What to Include Every Month
An SEO client report is the document your client reads every month to decide whether the SEO work is going anywhere, and whether the retainer is still worth paying. So if you are building one from scratch, or fixing one your clients have quietly stopped reading, this guide will surely help.
I have worked on SEO for a lot of businesses over the years, big and small.
Every client measures success a little differently, so one report format cannot fit all of them. But most monthly reports need the same few parts, mainly the business outcomes, search visibility, the pages that moved, the work you shipped and the plan for next month, and in this guide I will try my best to cover those properly.
In addition to that, I have put together a free Monthly SEO Report Template in PDF and Word that you can download further down. Or, if you would rather hand the SEO and the reporting to someone else, you can always reach out to me. Without further ado, let’s get started.
What an SEO Client Report Is For
A monthly SEO report sits between the work and the invoice. It is the one place where the client sees what their money bought, so it has 3 questions to answer, in this order:
- Are we moving toward the goal we agreed on?
- What did you do this month, and what did it change?
- What happens next, and what do you need from me?
An SEO client report that answers these on the first page gets read. A report that makes the client dig for them gets skimmed, filed and brought up again only when someone wants to cancel.
Most SEO reports fall into one of two groups. The first is the tool export: 30 pages of charts, every metric the rank tracker can print, and not one sentence saying what any of it means. The second is the one-line email that says “traffic is up 12%” and nothing else, which feels clear right until the month traffic goes down and there is no context to fall back on.
Neither is a good idea. The export hides the answer and the one-liner hides the reasoning. The sensible middle is a one-page summary written in plain words, with the evidence sitting underneath it for anyone who wants to check the numbers.
The summary is the report. Everything below it is evidence.
What to Include in a Monthly SEO Report
A monthly SEO report generally needs 6 parts. Some clients need more detail in one of them, but dropping any of the six leaves one of their questions unanswered.
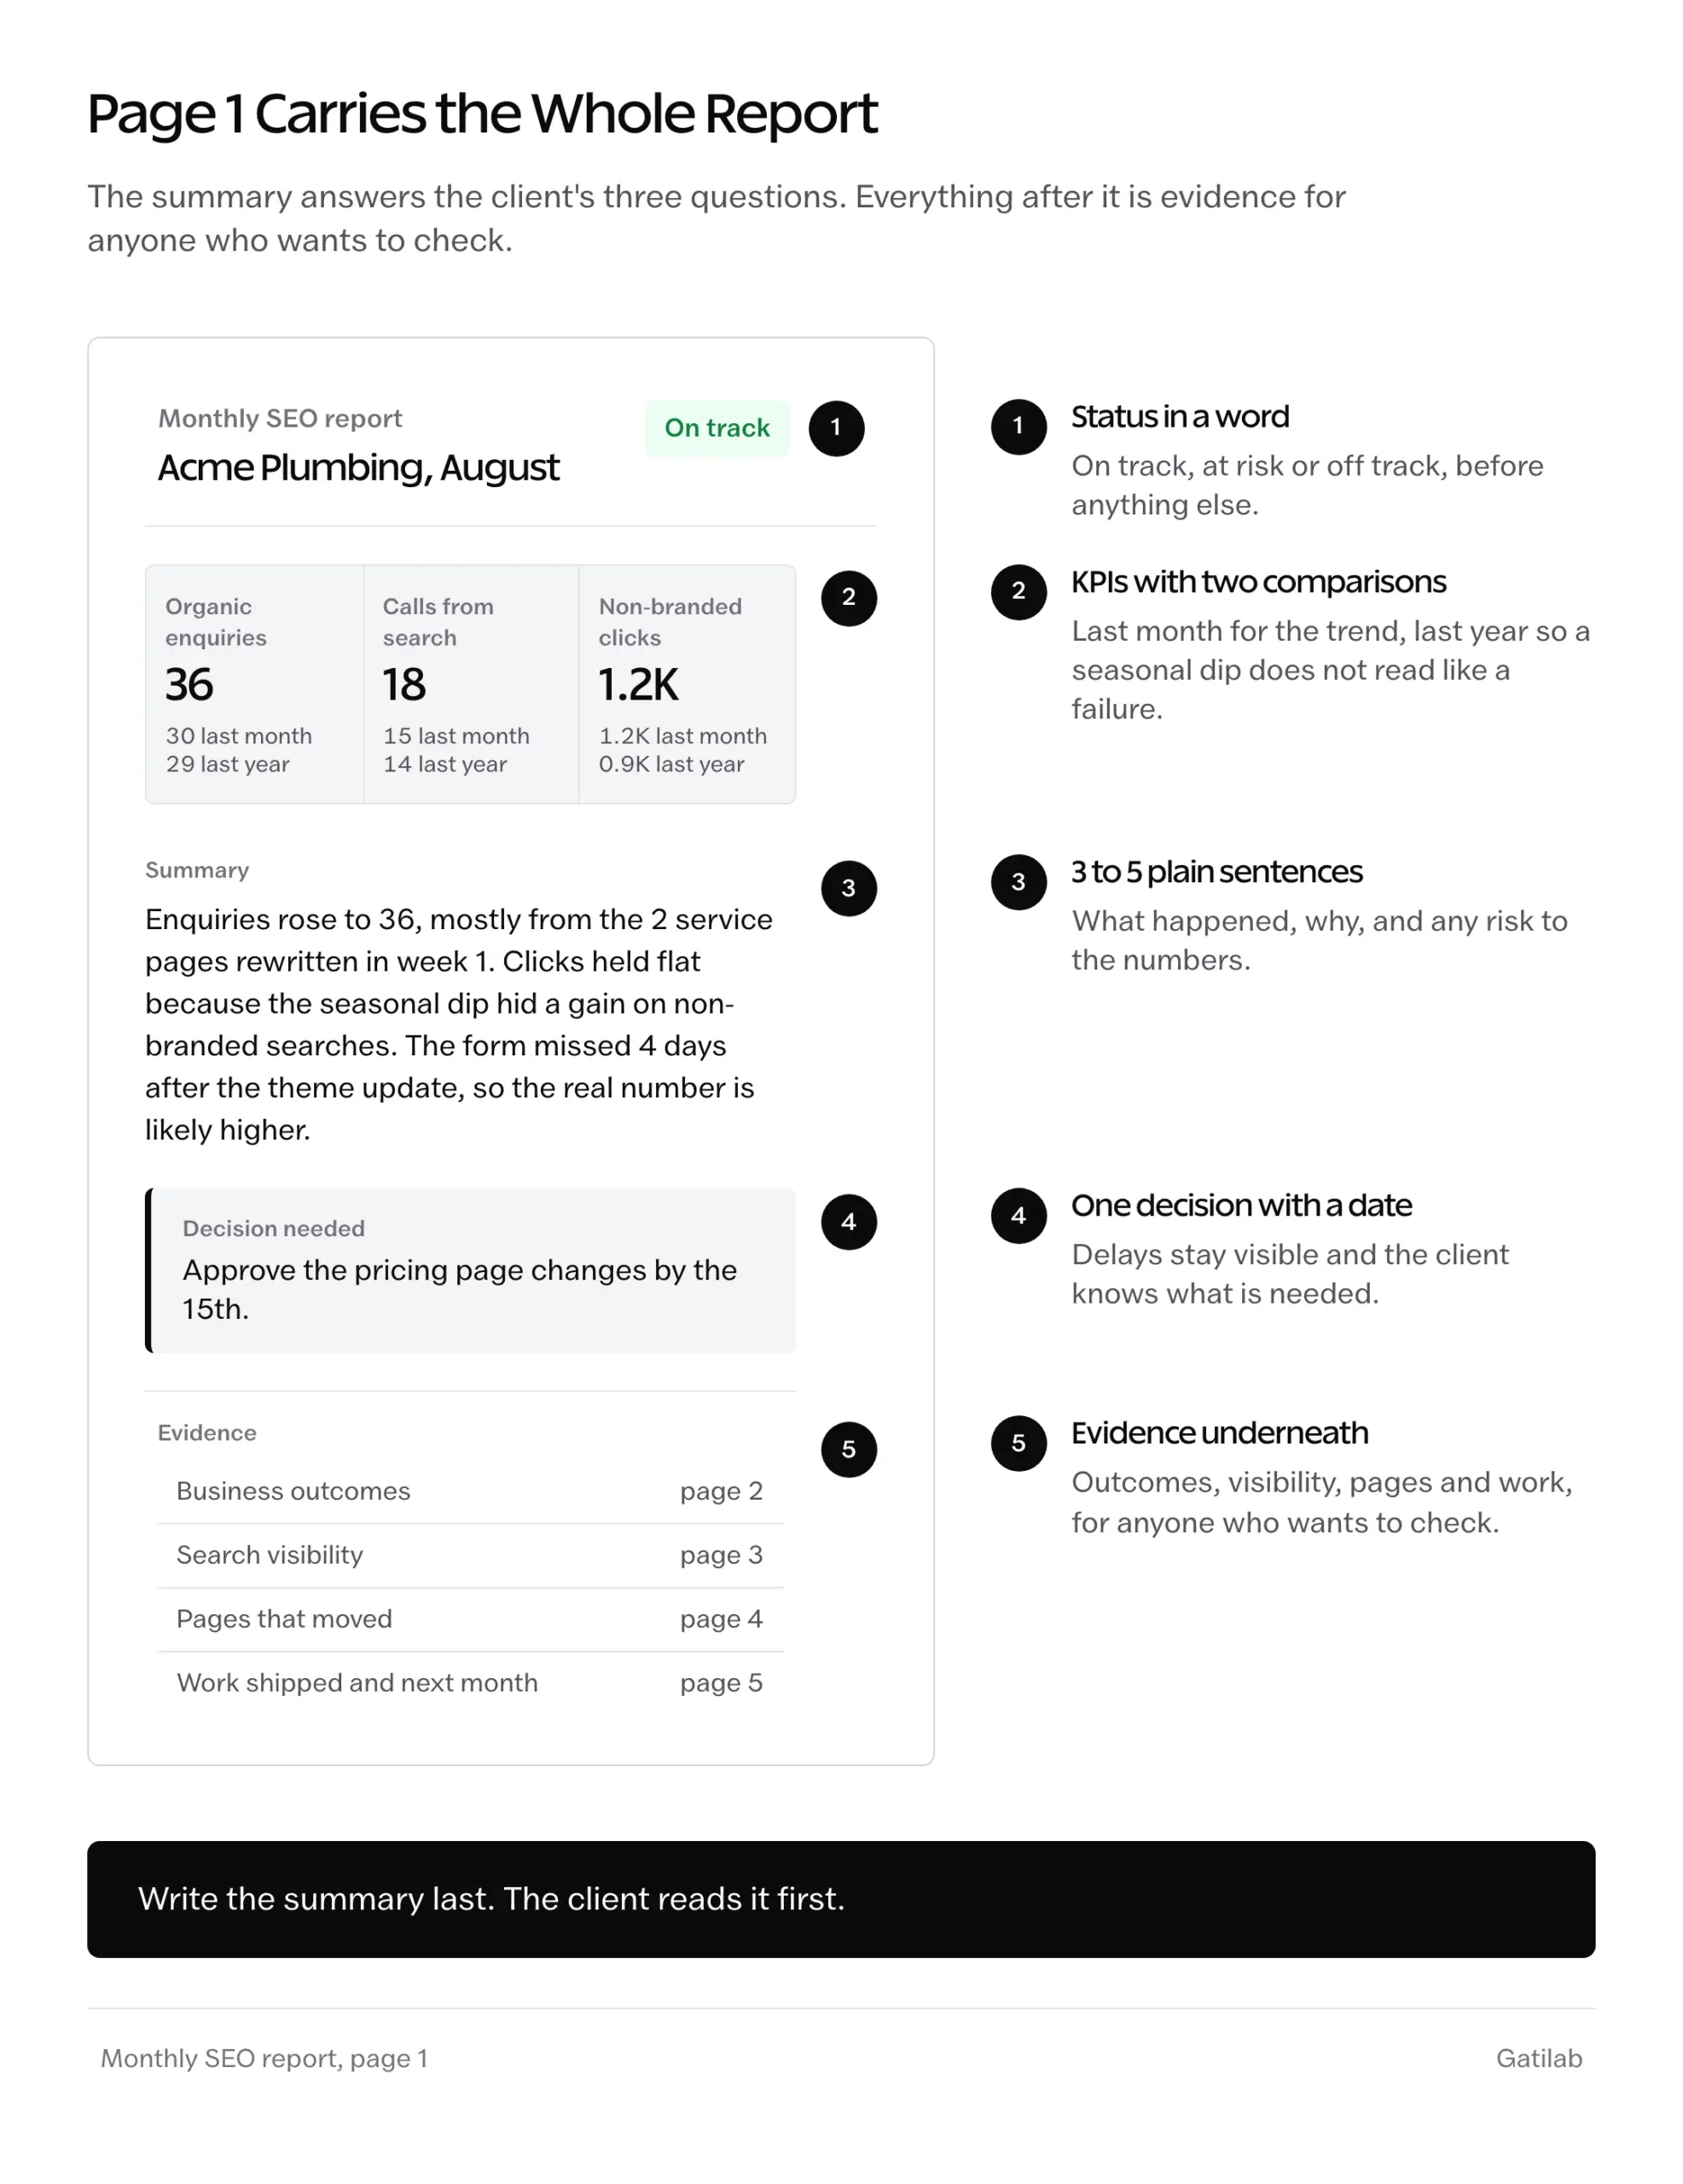
Executive Summary
The executive summary is 3 to 5 sentences at the top of the first page. It says whether the month was good or bad, why, and what the client needs to decide. It should be written last, after every number has been checked, and for the person who will read nothing else.
Here is an example for a made-up plumbing company:
Organic enquiries rose from 30 to 36 this month, mostly from the 2 service pages we rewrote in the first week. Search clicks were flat because the seasonal dip hid a gain on non-branded searches. One risk: the contact form stopped recording submissions for 4 days after the theme update, so the real number is likely a little higher. We need your approval on the pricing page changes by the 15th.
It names the outcome, the reason, the risk and the decision, and a client can read it in 30 seconds.
Business Outcomes
This is the part the client actually pays for, so it comes right after the summary. It shows the 1 to 3 outcomes you agreed on when the engagement started, with the same definition every month:
- Leads or enquiries from organic search, counted as a GA4 key event such as a form submission or a call click
- Sales and revenue from organic search, for an online store
- Calls, direction requests and bookings for a local business, from the Google Business Profile Performance report as well as the website
GA4 now calls conversions “key events”, so if a client’s older reports talk about conversions, it is the same idea under a new name.
Each outcome should sit next to last month and the same month last year. The year-on-year column is the one that stops a seasonal dip from reading like a failure.
Search Visibility
Search visibility tells you whether more people are finding the site in Google, even in months when the outcomes have not moved yet. These numbers come from Google Search Console:
- Clicks: visits from Google Search to the site
- Impressions: how often a page from the site appeared in the results
- Click-through rate: clicks divided by impressions
- Average position: the average rank across every query and every impression
Average position needs one sentence of explanation in the report, because it confuses almost everyone. When a site starts appearing for new searches at position 40 or 50, those impressions pull the average down, so the average can get worse in the same month traffic goes up.
Two adjustments make these numbers honest.
First, split branded and non-branded searches. Branded searches come from people who already know the business, so they rise with ads, word of mouth and a busy season, and they say very little about SEO. In the Performance report, add a query filter, pick the custom regex option, set it to “Doesn’t match regex” and enter the brand name with its common spellings:
acme|akmeSearch Console matches partial text and ignores capital letters, so “acme” also catches “acme plumbing” and “Acme reviews”. The report now shows only the searches the SEO work had to earn, which is the number worth tracking month to month.
Second, look at AI features separately. Search Console has a generative AI performance report that counts how often the site’s pages appeared in AI Overviews and AI Mode. It shows impressions, pages, countries and devices, but no clicks, so it belongs in the report as a visibility signal and not as traffic. For a fuller check, the AI visibility audit goes through mentions, citations and the queries worth watching.
Pages That Moved
Totals hide the story. A flat month can be 5 pages gaining and 5 pages losing, and the client needs to know which ones and why. So this section lists the biggest gainers and losers by clicks, with one line of reasoning each.
A made-up example of what it looks like:
| Page | Change in Clicks | Likely Reason | Next Action |
|---|---|---|---|
| Boiler repair service page | Up | Rewritten intro and new FAQ, now showing for more “near me” searches | Link to it from the 3 related guides |
| Low boiler pressure guide | Down | An AI Overview now answers the question above the result | Add the step-by-step fix and a short video, then watch the click-through rate |
| Emergency plumber page | Flat | Rankings steady, fewer searches in a quiet month | No change, check again next month |
The reason column matters more than the change column. “Down 40%” worries a client. “Down because Google now answers the question at the top of the page, and here is what we are doing about it” is something they can work with.
Work Shipped
This section lists what was actually done, mapped to the scope you agreed on. Every item should point to something the client can check, like a published page, a fixed redirect or a closed ticket. For example:
- Rewrote the intro and FAQ on 2 service pages
- Fixed the redirect chains left over from the old site
- Published 1 new guide and linked it from 3 existing pages
- Waiting on client: Google Business Profile access, pricing page approval
The “waiting on client” line is important. It keeps delays visible, and it stops a stalled month from looking like a lazy one. If the recurring work itself needs a structure, the monthly SEO checklist covers what should happen every month.
Next Month
The report closes on what happens next: 3 to 5 commitments, each with an owner and a date, plus any risk or decision the client should know about. A commitment without an owner tends to slide into the following month, and then the one after that.
Choosing the KPIs
KPIs should be settled before the first report, not invented in month 3 when the numbers look awkward. The best place to agree on them is the proposal, and the measurement section of this SEO proposal template shows how to write them down.
Three to five KPIs is generally enough. Each one needs a definition, a source and a starting number:
- Qualified organic enquiries: form submissions and call clicks from the Organic Search channel in GA4, with spam removed
- Non-branded organic clicks: Search Console clicks with the brand regex excluded
- Organic revenue: purchases attributed to Organic Search in GA4
- Local actions: calls, direction requests and website clicks from the Google Business Profile Performance report
Rankings can sit in the report as supporting evidence, but they make a weak KPI. A tracked keyword list is a sample the agency chose, and it is easy to choose a sample that always looks good.
Why Search Console and GA4 Never Match
A client who compares the two tools will find that they never agree, so it is worth explaining once in the first report instead of every month on a call.
Search Console counts clicks from Google Search. GA4 counts sessions from any source it can identify. The gap comes from a few places:
- GA4 only records a visit when its tag loads, and a consent banner means some visitors are never recorded or are only modeled; Search Console counts the click either way
- A single click can turn into more than one session, and some sessions never came from a click at all
- Search Console hides rare queries for privacy, so totals by query come out lower than totals by page
- GA4 sorts traffic into channels by its own rules, and some Google traffic ends up under Direct or Referral
It is wise to pick one source per question and keep it that way. Search Console answers “how visible are we in Google?” and GA4 answers “what did those visitors do?” The comparison of Google Search Console vs Google Analytics goes deeper if a client wants the full picture.
How to Explain a Bad Month
Every SEO program has bad months, and the report is where trust is either built or lost during one. A drop explained clearly usually buys more patience than a gain explained vaguely.
Check the causes in this order, because the first ones are the quickest to rule out:
- Seasonality. Compare with the same month last year before anything else. A tax consultant in May and a heating company in July will both look like they are falling.
- Tracking. Check that the GA4 key events still fire and that nothing changed in the consent banner or the tags. A drop that starts on the exact day of a site update is usually a tracking problem, not a ranking one.
- Site changes. Look for anything shipped in that period, like a redesign, a plugin that added noindex, URLs changed without redirects or a slower hosting setup.
- Google updates. Match the dates against Google’s Search Status Dashboard, which lists confirmed ranking updates.
- Search results changes. Look for pages with steady rankings but a falling click-through rate. That usually means an AI Overview, a map pack or more ads now sit above the result, which the article on ranking at position 4 with a 0.5% click-through rate explains in detail.
- Competitors. Check who took the positions you lost and what their page does better.
What most reports say in a bad month:
Traffic decreased by 18% this month due to algorithm volatility. We will continue monitoring the situation.
What works better:
Non-branded clicks fell 18%, almost all of it on 3 blog posts where Google now shows an AI Overview above our result. Rankings on those pages have not changed, but fewer people scroll down to click. Service page traffic and enquiries held steady. This month we are adding the step-by-step fixes and comparison tables that a summary leaves out, and we will report the click-through rate on those 3 pages separately so you can see whether it recovers.
It is the same drop, but the second version tells the client where it happened, why, what it cost the business and what happens next.
Monthly SEO Report Template (PDF and Word)
Everything in this guide is laid out in one template, so the first report takes an afternoon and the ones after it take much less.
- A one-page summary sheet with status, reasons and the decision needed
- Outcome and visibility tables with last month and same month last year columns
- Gainer and loser tables with a reason column for every page
- Work shipped, waiting on the client and next-month commitments with owners
- A checklist for explaining a down month, in the order that rules causes out fastest
Free to use on your clients or your own site, and fine to put your own logo on.
Tools for SEO Client Reports
A report can be put together in a spreadsheet, but most agencies generally use one of three kinds of tools:
- Looker Studio is free, connects directly to Search Console and GA4, and refreshes on its own. It can take a day to set up properly, and it will not write the summary for you.
- Agency reporting tools like AgencyAnalytics, Whatagraph and DashThis pull many sources into branded reports that go out on a schedule. They suit agencies with many clients, and they generally charge by the number of clients, dashboards or data sources.
- SEO suites like Semrush and SE Ranking have report builders next to rank tracking and site audits, which is handy when the team already works inside one of them.
The tool matters much less than the paragraph at the top. A dashboard with no summary is still a tool export, just a better looking one.
The Limits
A report can show what changed and what you did, but it cannot always prove that one caused the other. SEO results show up weeks after the work, while seasonality, updates and competitors move in the same window. So “likely reason” should be written when the reason is likely, and “because” kept for the cases you can actually show.
Small sites have noisy numbers. When a page goes from 10 clicks to 15, a 50% rise is technically true and practically meaningless, so raw numbers should sit next to percentages whenever the starting number is small.
AI answers are only partly measured. Search Console reports impressions in AI Overviews and AI Mode but not clicks, and nothing from Google covers ChatGPT or Perplexity. Any AI visibility number in the report is a direction, not a total.
And a report does not replace a conversation. For the first few months, a short call to walk through the report catches the questions that would otherwise turn into doubt.
What Quietly Ruins an SEO Report
Changing the KPIs when the numbers turn. It feels like tidying up the report, and the client reads it as hiding something.
Reporting month over month only. Every seasonal business then looks like it is failing for half the year, and the client learns to panic on schedule.
Percentages without the raw numbers. “Up 200%” on a base of 3 leads sets an expectation the next month cannot meet.
Pasting tool screenshots with no sentence under them. The client has to read a chart they never asked for, and most will not try.
Burying the bad news on page 6. The client finds it eventually, and after that every good number in the report gets read with suspicion.
Sending the report and waiting. A report that arrives with no follow-up tends to stay unread until something goes wrong.
FAQs on SEO Client Reports
How often should you send an SEO report to a client?
Monthly works for most retainers, because SEO moves slowly and weekly numbers are mostly noise. Weekly updates make sense during a migration, a launch or a recovery. A quarterly review on top of the monthly report is a good time to revisit goals and scope.
How long should a monthly SEO report be?
The summary should fit on one page, and the whole report usually runs 3 to 6 pages. Anything longer probably belongs in an appendix or a separate audit.
What should the first SEO report for a new client include?
The first report is mostly a baseline. It records the starting numbers for every KPI, the main problems found during onboarding and the plan for the first 90 days, so every later report has something fixed to compare against.
What is the difference between an SEO audit report and a monthly SEO report?
An audit is a one-time diagnosis of what is wrong with a site and what to fix first. A monthly report tracks progress against the goals you agreed on and shows the work done since the last report.
How do you report on local SEO?
Add the Google Business Profile Performance numbers, mainly calls, direction requests, website clicks and bookings, next to local landing page traffic and enquiries. Map pack rankings change with where the searcher is standing, so a grid-based rank tracker gives a fairer picture than a single ranking.
Can I white-label an SEO report?
Yes. Looker Studio and most agency reporting tools let you use your own logo and colors, and the template in this guide is plain enough to rebrand in a few minutes.
Final Remarks
If you have followed along, you now have a report that answers the 3 questions a client actually has, in the order they have them. The one idea worth keeping is that the summary is the report, and everything else in it is there to back that summary up.
The Monthly SEO Report Template above has every section ready to fill in, so the first report takes an afternoon and the ones after it take much less. And if you would rather have the SEO and the reporting handled for you, the team behind Gatilab’s SEO services can take it over, and I am always happy to talk it through.
I hope your next report is the one your client reads all the way to the end.
Tell Google you want more of this.
Add Gatilab as a preferred sourceOne tap, and this site shows up more often in your own Top Stories, AI Overviews and AI Mode. Remove it any time.