
Affiliate Marketing Statistics for 2026: Industry Size, Earnings, and Trends
US advertisers will spend about $13.8 billion on affiliate marketing in 2026 and that spend will drive roughly $241 billion of ecommerce sales, a return of about $11 in revenue for every dollar. Those are the two numbers most affiliate marketing statistics pages get wrong, usually by quoting a 2015 survey or a global “market size” that no one measured.
Most coverage of this channel falls into one of two camps. One treats affiliate as passive income and quotes an average monthly earnings figure that turns out to be a self-selected mean. The other declares it dead because Google’s AI Overviews halved clicks on informational searches. The measured picture is narrower than either: advertiser spend is growing at 11% a year, the traffic that feeds it is shrinking, and the money is concentrating in loyalty, cashback, and creators rather than review sites.
The channel is growing. The blog that used to feed it is not.
Every figure below names the organization that measured it and the year the data describes. That matters more in affiliate marketing than in most fields, because the industry has no regulator, no census, and a long habit of quoting network press releases as if they were surveys.
Key Affiliate Marketing Statistics
The figures that carry the rest of this page.
- $13.81 billion US affiliate marketing spend forecast for 2026, up 11.3% from $12.42 billion in 2025 (eMarketer, April 2026)
- $113 billion of US ecommerce sales driven by affiliates in 2024, 9.4% of all online retail, at about $11 per dollar invested (Performance Marketing Association, data from 8 networks)
- £20.7 billion of UK sales from £1.8 billion of affiliate spend in 2025, a 15 to 1 return (APMA, data from 11 networks)
- 50% of affiliate transactions on impact.com now come through loyalty and cashback partners; influencers drove 6% of transactions on 4% of spend (2,368 brands, about 1 billion transactions, 2025)
- 8% of Google visits with an AI Overview produced a click on a result, against 15% without one (Pew Research Center, 68,879 real searches, March 2025)
- 0% to 10% is Amazon’s current US commission range by category, with “all other” at 4%, and managed publishers reported cuts of up to 50% in March 2026
- $64.3 billion TikTok Shop global merchandise volume in 2025, up 94%, with 15.4 million active creators (Momentum Works and Tabcut)
- 9.09% of affiliate-channel clicks were invalid across 2 billion clicks from January 2025 to March 2026, down from 17% in 2022 (Opticks; CHEQ)
Affiliate Marketing Industry Size
The only affiliate spending figures built from network data rather than modelled are for the US and the UK, and both were published within the last 15 months. Start there, and treat any “global affiliate market” number as an analyst estimate until its method is visible.
- United States, advertiser spend: $12.42 billion in 2025 and $13.81 billion forecast for 2026, driving about $241 billion of ecommerce sales (eMarketer, April 2026)
- United States, measured: $13.63 billion invested in 2024, up 49% from $9.1 billion in 2021, producing $113 billion in sales, 9.4% of US ecommerce and roughly 15% of sales for brands that run a program (Performance Marketing Association with London Research, from Awin, CJ, Partnerize, Rakuten, ShareASale, and 3 others)
- United Kingdom: £1.8 billion spend, up 7.3%, generating £20.7 billion, 357 million tracked transactions, 14.8 billion clicks, and a 15 to 1 return (APMA, 2025 data, published 2026)
- Context: total US internet advertising was $294.6 billion in 2025 (IAB and PwC), which makes affiliate a sub-5% channel by spend and a far larger one by attributed sales
- Global estimate: Cognitive Market Research puts the global market at about $18.5 billion in 2024, projecting $31.7 billion by 2031, with North America around 40%. The methodology is paywalled, so treat it as an estimate, not a measurement
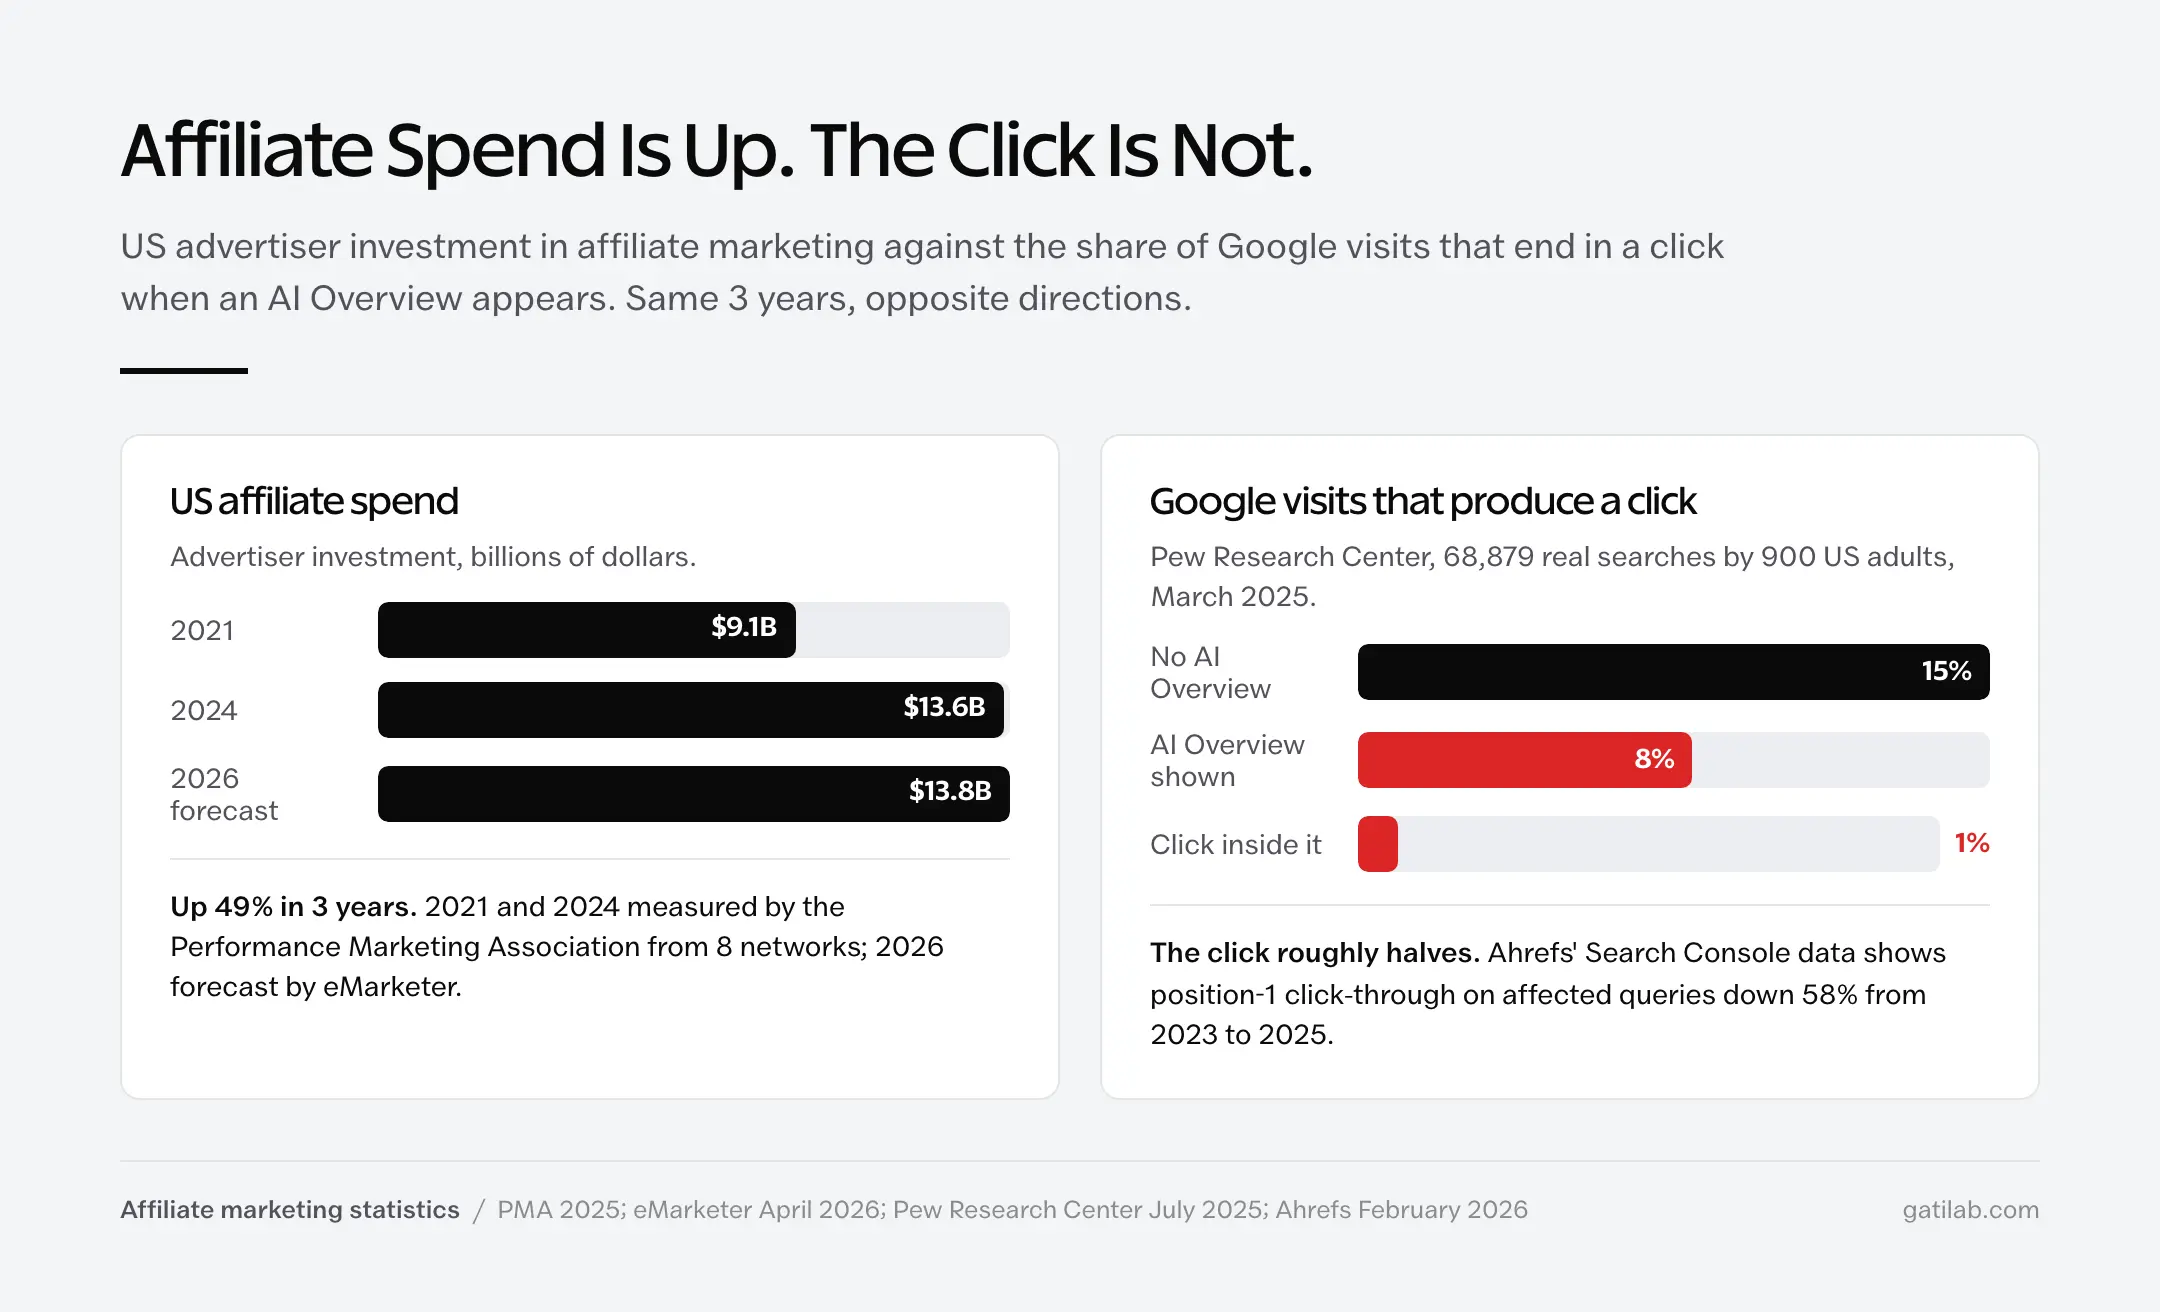
The PMA figure and the eMarketer figure describe the same thing from 2 directions and land within a billion of each other, which is about as good as agreement gets in this field. The 49% growth between 2021 and 2024 is the number to hold onto: it happened while organic traffic to affiliate sites was falling, which tells you the growth came from somewhere other than blog reviews.
On the UK side, 1 pound in every 7 spent online during Cyber Weekend 2025 was tracked through an affiliate link, up from 1 in 8 the year before. For 1 weekend a year, affiliate is not a channel. It is the checkout.
Where the Money Goes
The PMA study breaks US spend down by who is paying and who is getting paid, and both splits have moved since 2021.
| Advertiser sector | Share of US affiliate spend, 2024 | 2021 |
|---|---|---|
| Retail | 63% | 76% |
| Financial services | 15% | 12% |
| Travel | 9% | 5% |
| Telecoms | 7% | 3% |
On the publisher side, cashback and loyalty sites took 35% of US spend in 2024 and content creators 16%. Discount and promotion publishers took 42.4% of US affiliate revenue on the Awin network in the first half of 2025, up from 39.7%. Creators are the fastest-growing publisher type on that network, rising from 15.9% to 19.5% of revenue in a year.
Put those 2 facts together and the shape of the channel in 2026 is clear. Most of the money flows through the last click before checkout, a cashback extension or a coupon site, and the fastest-growing slice flows through a person on camera. The review article sits between those 2 and is losing share to both.
Affiliate Networks and Platforms
The network layer consolidated in 2025. ShareASale, one of the oldest US networks, migrated its 9,500 advertisers and 250,000 publishers into Awin in August and shut its platform on 6 October 2025. What remains is a small number of large platforms that disclose their scale in very different ways.
- Awin: 1 million publishers, 30,000 advertisers, $19 billion of advertiser revenue, and $1.4 billion paid to publishers in its last financial year (company page, August 2026)
- impact.com: about $120 billion in partner-referred merchandise value, more than $5 billion in partner payouts, nearly 350,000 active partnerships, and $270 million in annual recurring revenue for the year to January 2026
- CJ: more than $16 billion in annual advertiser revenue and 157 million transactions a year (company page)
- Rakuten Advertising: 150,000+ partners; its consumer arm Rakuten Rewards has 12 million US members and has paid over $1 billion in cash back
- Amazon Associates: the largest program in the industry has never disclosed its size. The only figure Amazon ever published, “over 900,000 members,” is from 2008 sign-up page metadata
You will see “Amazon holds 46% of the affiliate market” quoted as fact. That figure is a crawler counting which affiliate scripts appear on websites, not revenue, and the same crawler still listed ShareASale months after it closed. BuiltWith’s equivalent detection puts Amazon at 23% of sites using any affiliate technology. Neither number says anything about money.
The more useful network statistic is about tracking, not size. In a 25,000-sale sample, Awin found 22% of conversions were visible only through server-to-server tracking, meaning roughly 1 sale in 5 was being lost to browser privacy changes before the network fixed it. Its recovery program had reclaimed $578 million for partners by April 2026. If your program still relies on third-party cookies, a fifth of your commissions may be evaporating at the browser.
Affiliate Commission Rates
Commission rates are the one area where primary sources are easy to read and almost nobody does. The schedules are public. Here is Amazon’s US rate card as published in August 2026.
| Amazon.com category | Standard commission |
|---|---|
| Luxury beauty, Amazon Explore | 10% |
| Digital and physical music, handmade, digital video | 5% |
| Physical books, kitchen, automotive | 4.5% |
| Amazon devices, apparel, shoes, jewelry, luggage, watches, all other categories | 4% |
| Toys, furniture, home, garden, pets, beauty, sports, tools, baby, outdoors | 3% |
| PC and components, DVD and Blu-ray | 2.5% |
| Televisions, digital video games | 2% |
| Grocery, Amazon Fresh, health and personal care, physical video games and consoles | 1% |
| Gift cards, wireless plans, alcohol, vehicles, Kindle subscriptions | 0% |
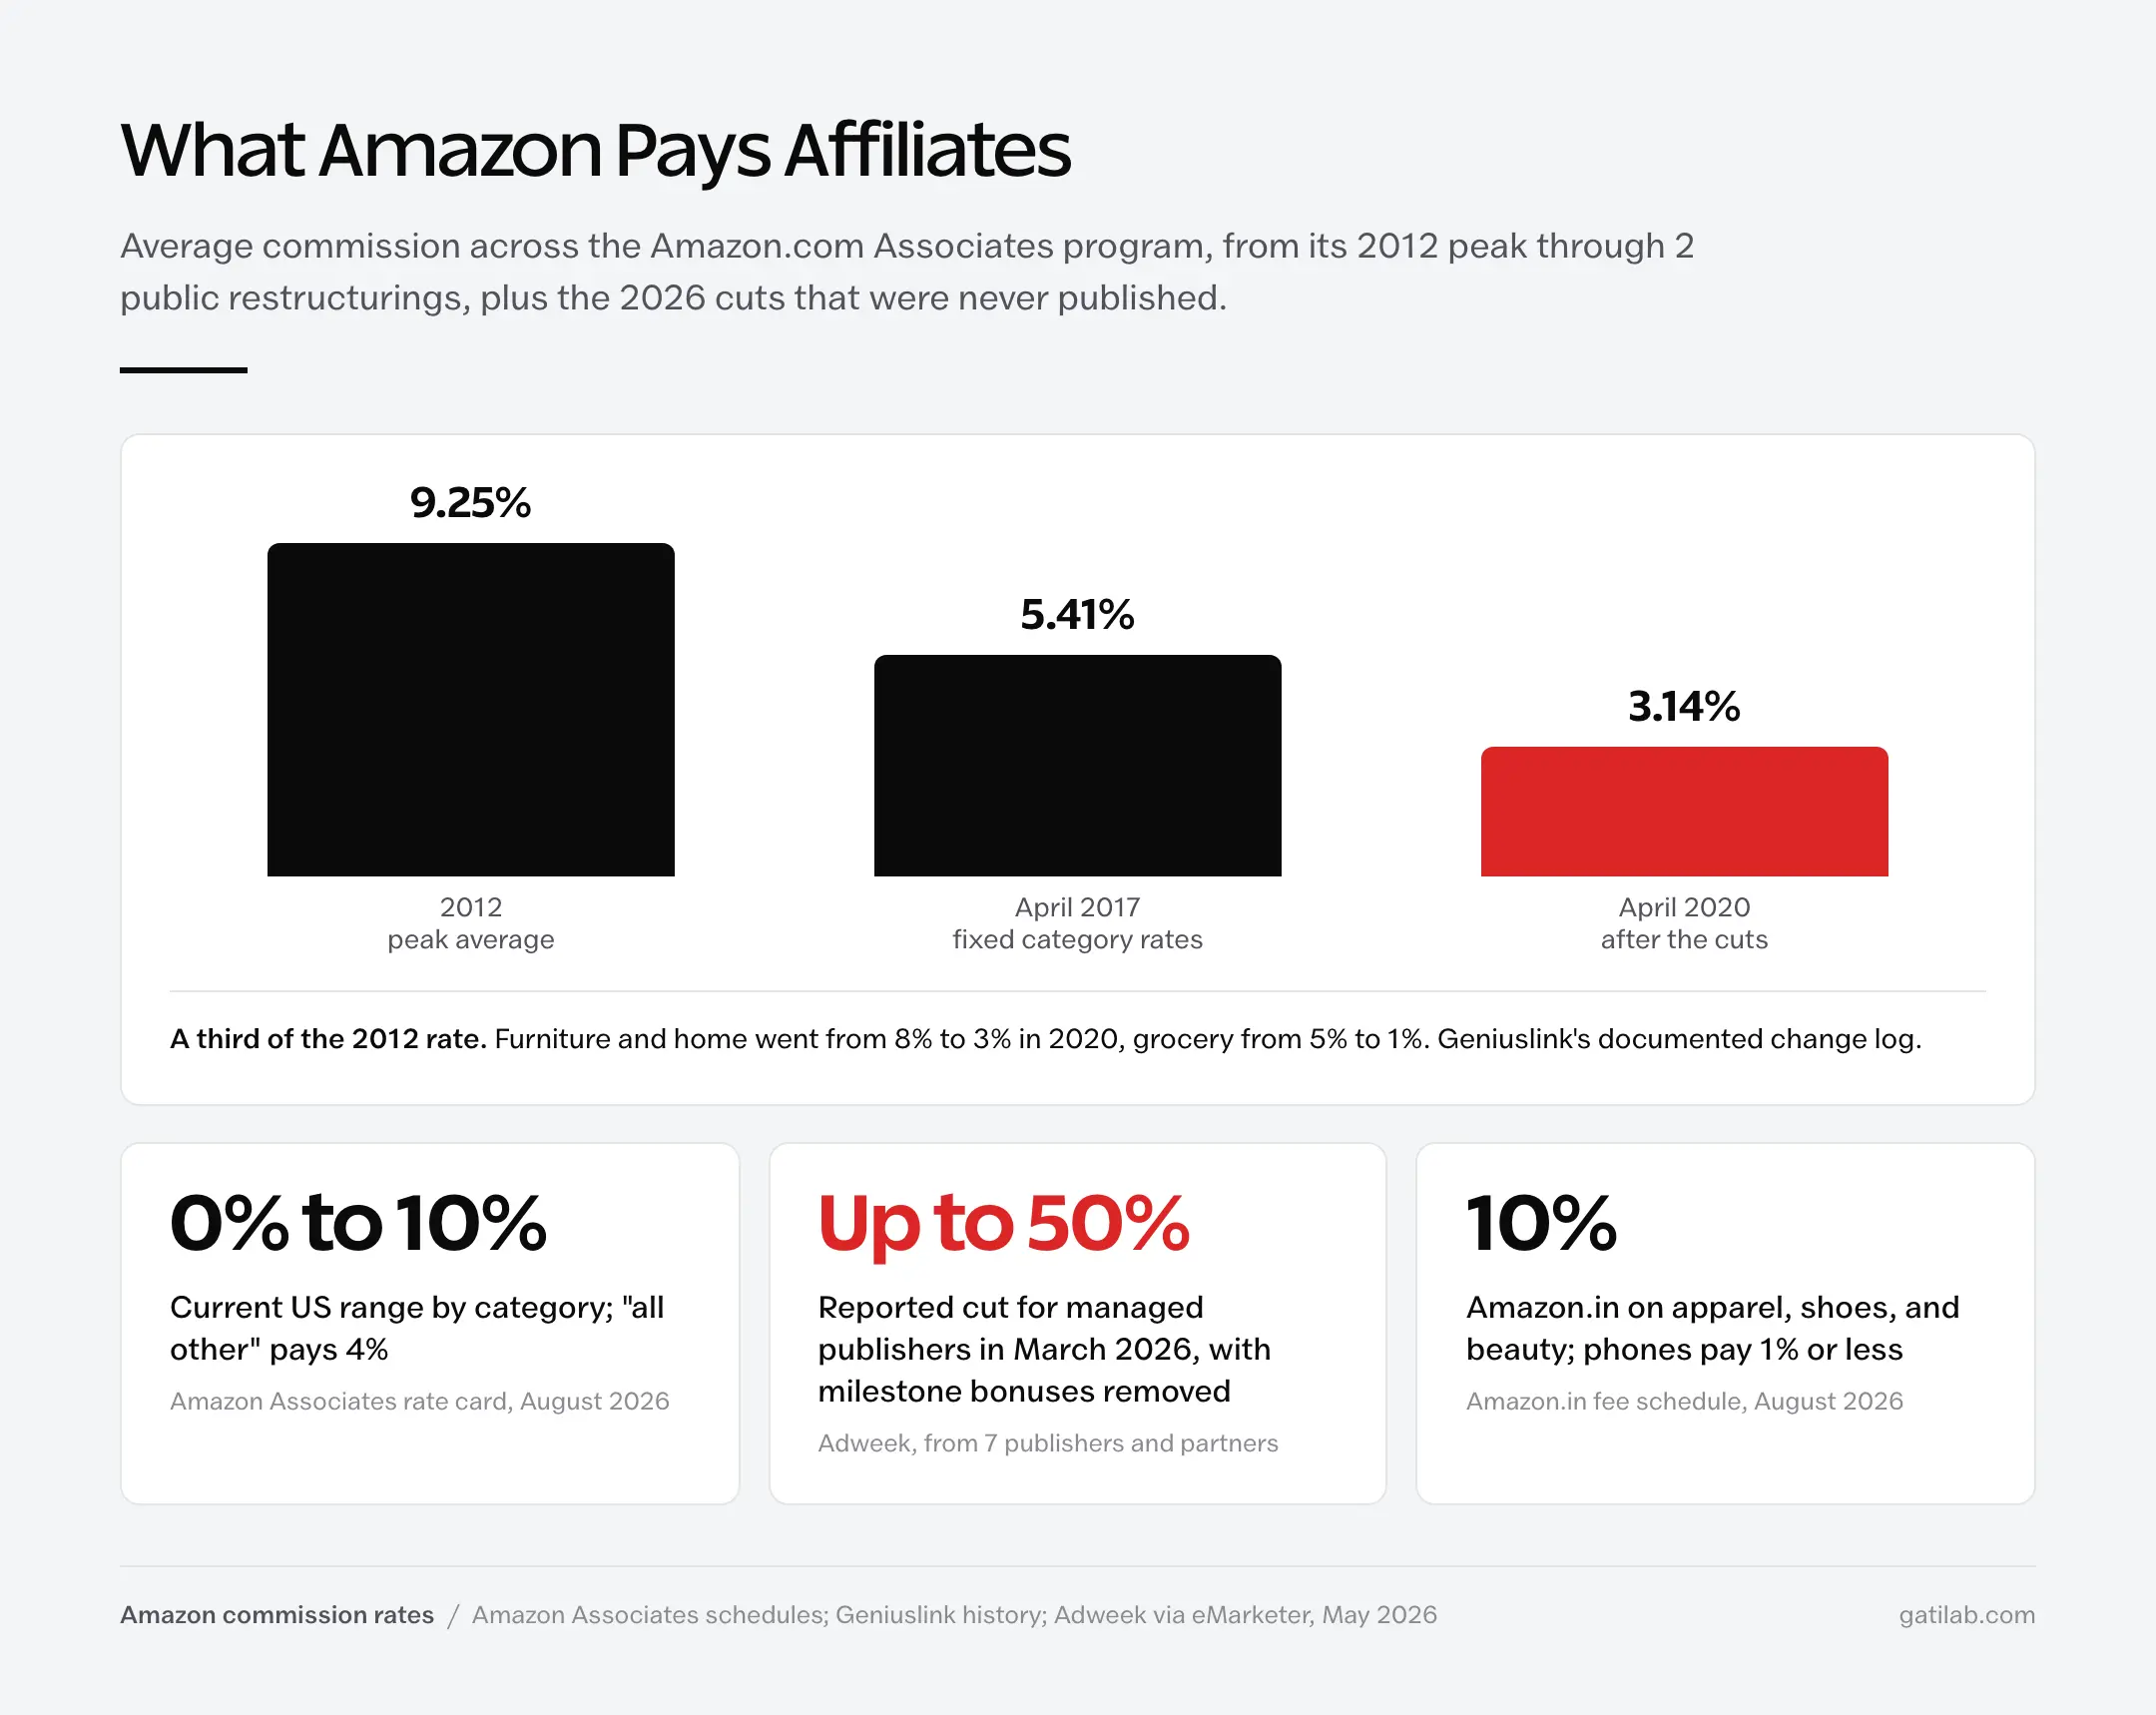
Two things about that table. There is no 20% games tier, despite what older roundups say. And the structure is the survivor of 2 big cuts: Amazon moved from volume tiers to fixed category rates in April 2017, then cut again on 21 April 2020, taking furniture and home from 8% to 3% and grocery from 5% to 1%. The average rate across the program fell from about 9.25% in 2012 to 3.14% in 2020, according to Geniuslink’s change log.
The 2026 round was quieter and sharper. Around 9 March 2026, according to Adweek’s reporting from 7 publishers and partners, Amazon cut rates for managed publishers by up to 50% in some categories, dropped milestone bonuses for most, raised reporting thresholds, and withdrew product-level reporting. It was communicated through account managers, not a public schedule change. One deal publisher expected its 2026 Amazon revenue to land 50% below plan.
Same program, a third of the rate it paid 14 years ago, and the largest publishers found out by phone.
India’s schedules run higher, which matters if your audience is there.
- Amazon.in (effective August 2026): apparel, shoes, luggage, watches, and beauty at 10%; books, toys, baby, and sports at 5.9%; kitchen, furniture, and home at 5%; electronics, TVs, and PCs at 3.5%; mobile phones at 1% with many models at 0% to 0.5%; all other at 5%
- Flipkart Affiliate (July 2026): fashion and lifestyle at 8%; books and general merchandise at 5%; home, furniture, and electronics at 3%; mobile phones at 1%, 0.5%, or 0% by tier; gift cards at 0%
The pattern holds across every marketplace: apparel and beauty pay 8 to 10%, electronics and phones pay close to nothing. A phone review that converts at the same rate as a shoe review earns a tenth as much. Choose your niche by the rate card, not the search volume.
How Much Affiliate Marketers Earn
No network, platform, or regulator publishes a median affiliate income. Every “the average affiliate earns X a month” figure in circulation comes from one survey or from an aggregator’s invention, and it is worth understanding the one survey before quoting it.
- Authority Hacker surveyed 2,270 people from its own email list, podcast audience, and paid ads in 2024. Respondents averaged 2.8 years of experience and skewed toward website owners
- Mean monthly income: $8,038. No median was published, which for an income distribution means the typical respondent almost certainly earned far less
- Affiliates with 3 or more years of experience earned about 9.45 times those with under 1 year
- 45.3% named traffic as their biggest challenge; 82% of six-figure earners also ran display ads
- The original survey page went offline in 2026; the figures survive only through mirrors
A self-selected mean from people who opted into an affiliate marketing newsletter, with no median, from a page that no longer exists. It is the best earnings survey that exists, and it tells you almost nothing about what a new affiliate should expect.
Total payouts are the better proxy, because they are counted. impact.com paid partners more than $5 billion in its last fiscal year. Awin paid $1.4 billion. UK publishers collectively generated £20.7 billion in sales. Divide any of those by the number of active publishers and the result is small, because most publishers earn close to nothing and a few earn a great deal. That is the real earnings statistic: the distribution is a cliff, and the survey means describe the people standing on top of it.
The “95% of affiliates fail in their first year” line is the other half of this. It has no source. It traces to a 2008 Warrior Forum post quoting an article directory, and no study has produced it since. Most new affiliates do earn very little, but nobody has measured how many, and a made-up failure rate is no more useful than a made-up average.
Affiliate Traffic and AI Overviews
The traffic that fed review-style affiliate sites has fallen by more than half since 2023, and 2 separate measurements, one behavioral and one from Search Console data, agree on the size of the cut.
- Pew Research Center tracked 900 US adults through 68,879 real Google searches in March 2025. Users clicked a result on 8% of visits where an AI Overview appeared, against 15% without one. They clicked a link inside the Overview on 1% of visits. They ended the session entirely on 26% of Overview pages, against 16% otherwise
- Ahrefs compared 300,000 keywords across Search Console data from December 2023 to December 2025. Position 1 click-through on queries with an AI Overview fell from 7.3% to 1.6%, 58% below the counterfactual. Position 2 fell 51%, position 3 fell 46%, and even position 10 fell 19%
- About 18% of the searches in Pew’s sample produced an AI summary, and 88% of those summaries cited 3 or more sources
The click roughly halves when a summary appears, and almost nobody follows the citation out of it. For a site whose business model is ranking first for “best X” and earning a commission on the click, that is not a traffic dip. It is the removal of the step the whole model depends on.
Google’s policy changes hit a different set of sites. The site reputation abuse policy, enforced from May 2024 and tightened in November 2024 to remove the first-party exemption, targeted affiliate sections hosted on news brands. Sistrix data shows forbes.com’s search visibility fell 62% in 2024, with its Advisor, Health, and Home Improvement sections dropping to zero after manual actions on 19 November 2024. Independent sites were not spared: HouseFresh, a product-testing publisher, documented its daily Google visitors falling from about 4,000 to about 200 between October 2023 and the March 2024 core update.
From 4,000 to 200. A 95% cut to a site that tested the products it reviewed.
The “71% of affiliate sites lost traffic in the December 2025 core update” figure that circulates is a paid press release from an SEO agency, with no sample or method, about a different update. Do not repeat it. The 2 measured studies above are worse news and better sourced. If your own pages are losing clicks, a traffic checker will show the decline, but only Search Console will tell you whether an AI Overview sits on the queries that used to convert.
AI Shopping Agents
The next layer of disintermediation is the assistant that buys for you, and it has an attribution problem nobody has solved.
- Amazon Rufus was used by more than 300 million customers in 2025 and drove nearly $12 billion in incremental annualized sales, per Amazon’s fourth-quarter release. Rufus users were 60% more likely to complete a purchase
- OpenAI’s Instant Checkout launched inside ChatGPT in September 2025 and was wound down in March 2026 after roughly 30 merchants integrated. Walmart reported in-chat checkout converting at a third of the rate of a click-through to its own site
- About 70% of ChatGPT’s mentions of one eyewear brand were sourced from affiliate content, and more than a quarter of OpenAI’s publisher partnerships involve publishers with scaled affiliate operations (eMarketer, April 2026)
- Honey, PayPal’s coupon extension, fell from 20 million Chrome users in November 2024 to 12 million by the end of 2025 after an investigation showed it replacing creators’ affiliate tags at checkout. Chrome’s store policy now bans affiliate-code injection without a user benefit
The structural gap: no AI assistant publishes how it attributes or pays the publishers whose content informs a purchase. Rufus revenue is counted as Amazon’s. ChatGPT reads affiliate reviews to form its recommendations and pays nobody for them. The content still does the work. The commission no longer follows it.
Creator and Social Commerce
While search-driven affiliate traffic fell, creator-driven affiliate sales grew faster than any other part of the channel, and the platforms now publish enough to size it.
- TikTok Shop reached $64.3 billion in global merchandise volume in 2025, up 94%, with US volume at $15.1 billion, up 68%. 15.4 million creators were active on the platform. Of 803,500 US stores, more than half sold nothing and over 2,000 passed $1 million (Momentum Works and Tabcut, February 2026)
- On impact.com in 2025, influencers drove 6% of transactions on 4% of brand spend, with transaction volume up 65% and conversion rate up 8%. During Cyber Week, creator-driven revenue rose 51% while commission costs stayed flat
- LTK drives about $6 billion in annual retail sales across 7,000 retailers and 40 million monthly users. ShopMy facilitates more than $1 billion in annual sales through 185,000 curators and raised $70 million at a $1.5 billion valuation in October 2025
- Among 4,500 social media users in 8 countries, 56% of those who bought after creator content did so inside the platform’s own marketplace, and 28% needed to see a product 3 to 4 times before buying (impact.com and eMarketer Global Creator Commerce Study, 2025)
- Promo codes (45.9%) and affiliate links (26.0%) are the top 2 ways brands track influencer results (Influencer Marketing Hub, 600+ marketers, 2026)
The TikTok store figure is the one to sit with. More than half of 803,500 US stores sold nothing in a year. Social commerce has the same cliff-shaped distribution as affiliate earnings, with a thinner top. Which is also why choosing between TikTok and YouTube is a question about where your buyers already are, not about which platform publishes the bigger number.
How Shoppers Use Affiliate Links
The consumer side of the data explains the publisher side. People do not click affiliate links because they read a review. They click them because a link pays them back.
- Loyalty and rewards partners drove 50% of affiliate transactions and 50% of consumer spend on impact.com in 2025, on 33% of brand spend
- Cashback and loyalty publishers took 35% of US affiliate spend in 2024; coupon and promotion publishers took 42.4% of US affiliate revenue on Awin in the first half of 2025
- Affiliate-acquired customers carry a 21% higher average order value than customers from other channels (Forrester Consulting for Awin, 2024)
- Among 4,500 social media users, 34% said they would be more likely to buy on a creator’s recommendation if the review looked less polished and included negatives
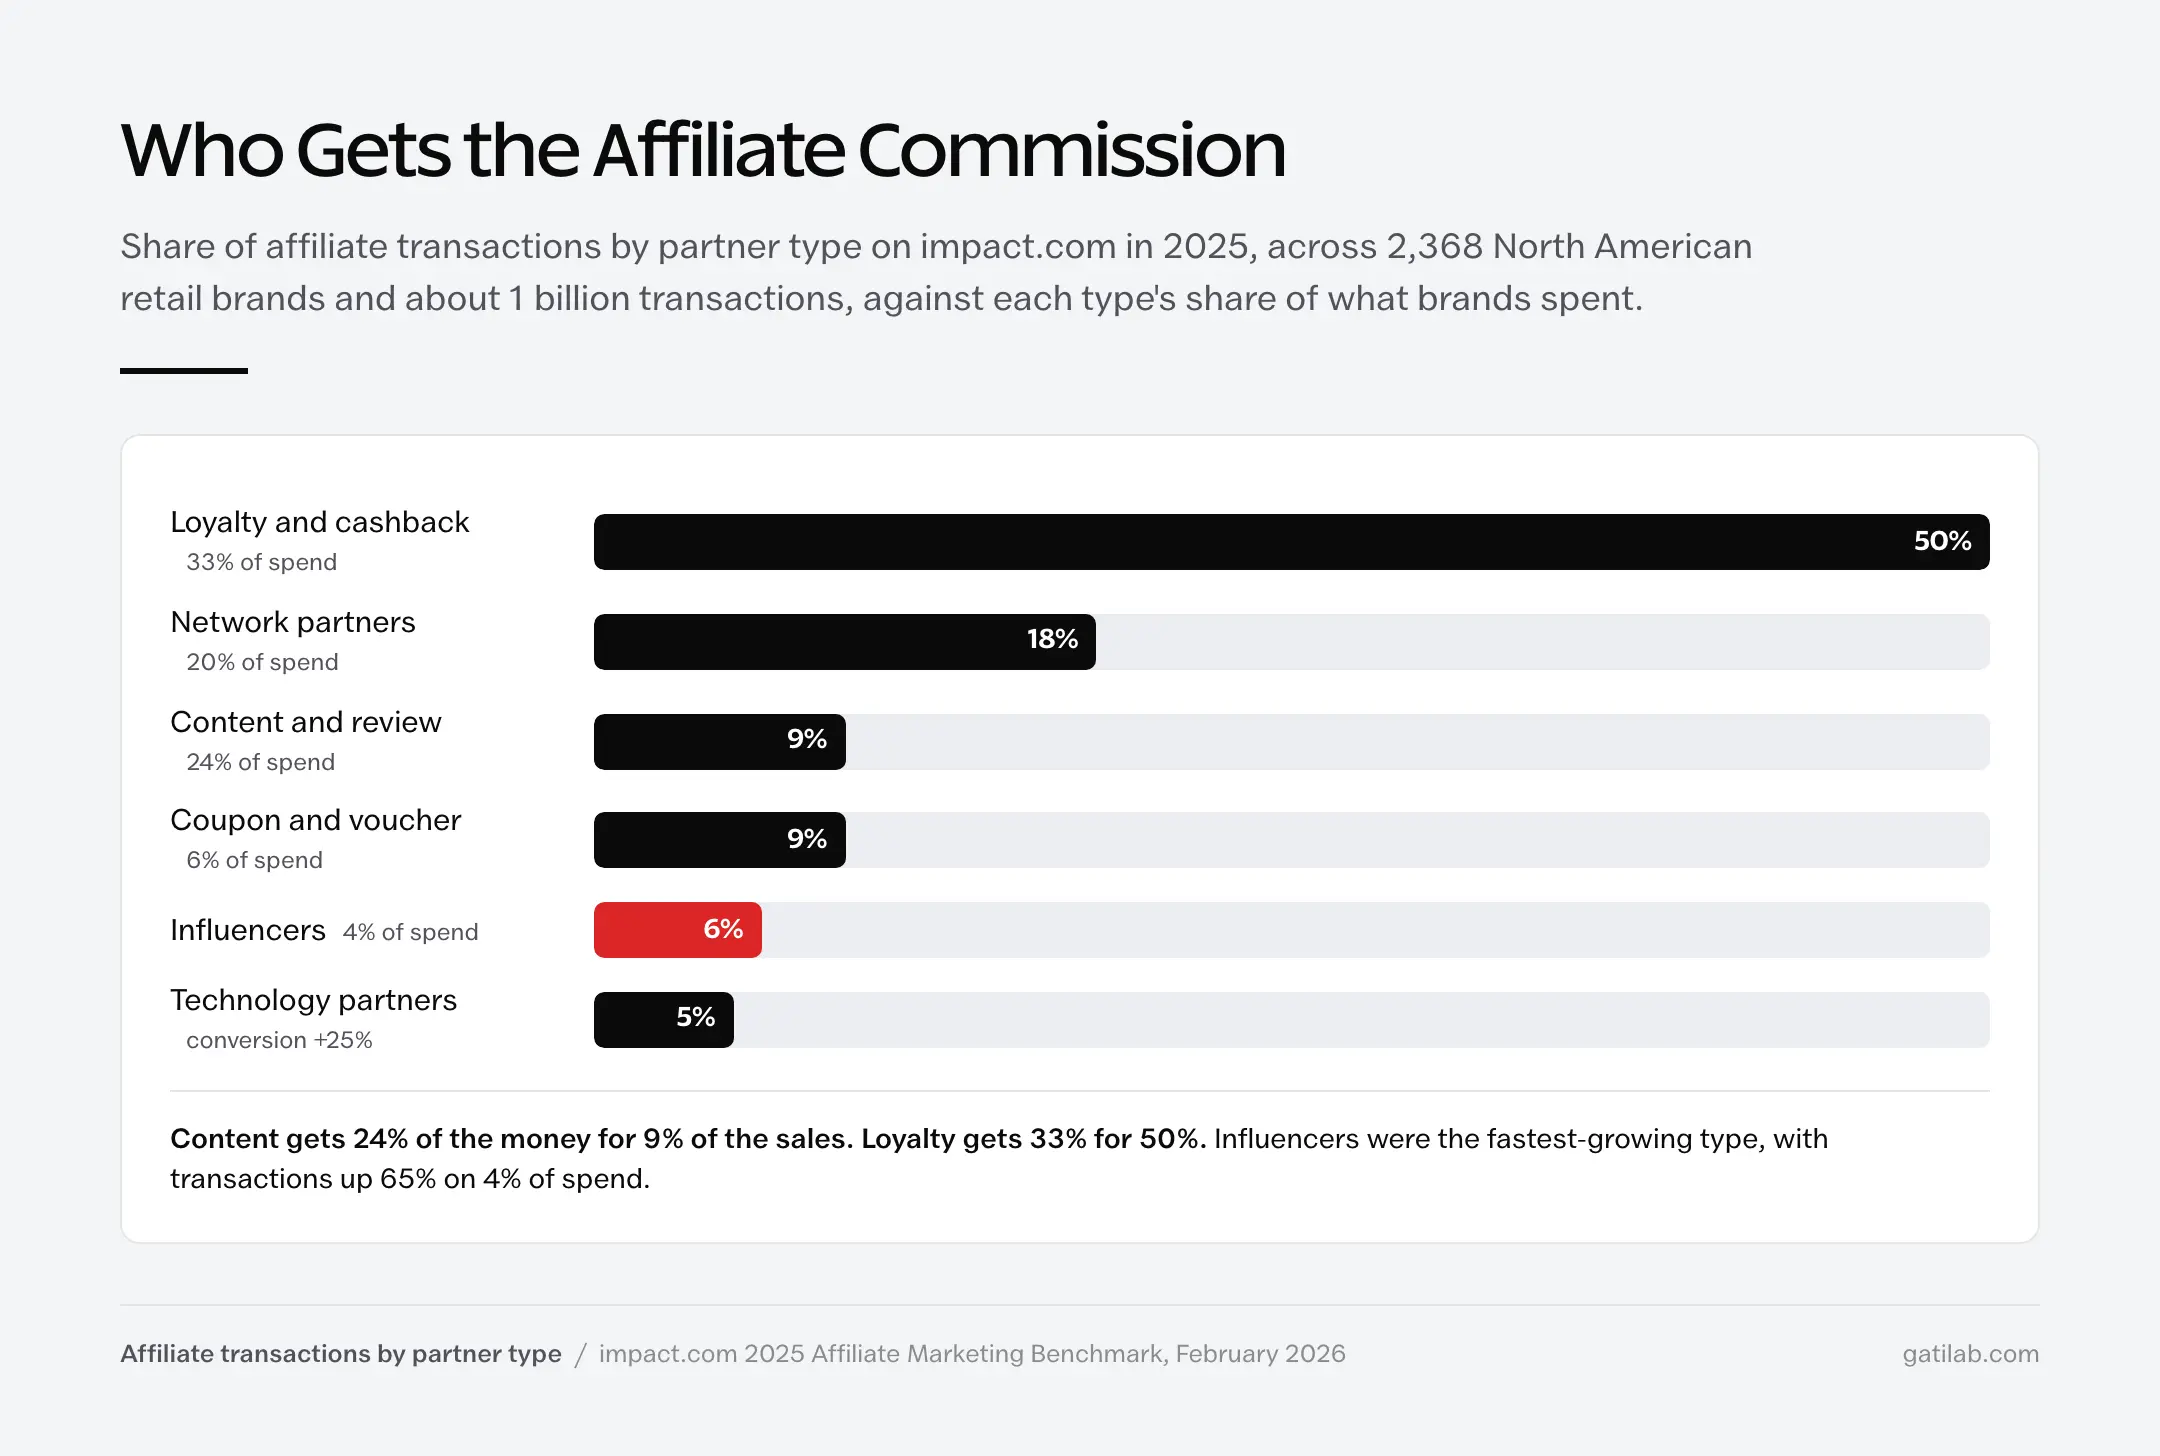
Half of every affiliate transaction at a major platform now runs through a loyalty partner, which means half the channel’s commissions are paid for a click that happened after the shopper had already decided to buy. Brands are paying for attribution, not persuasion. That is the uncomfortable arithmetic behind the “11 to 1 return” headline, and it is why attribution models matter more in affiliate than in any other channel.
Affiliate Fraud and Tracking Loss
Affiliate fraud is real, measurable, and smaller than the headlines, because the headline number is 4 years old.
- 9.09% of affiliate-channel clicks were invalid across more than 2 billion clicks in 243 territories between January 2025 and March 2026 (Opticks). Native advertising ran at 15.9%, programmatic 15.4%, social 10.6%, and search 2.2%
- The widely quoted “$3.4 billion affiliate fraud” figure is CHEQ’s 2022 projection, when it measured 17% invalid traffic. The rate has roughly halved since
- Across all digital advertising, Juniper Research estimated 22% of spend, about $84 billion, lost to fraud in 2023
- Tracking loss costs more than fraud: 22% of conversions in Awin’s 25,000-sale sample were invisible without server-to-server tracking, and advertisers that upgraded saw 37% more revenue attributed and 81% higher conversion rates
The fraud number most people quote is double the current rate. The tracking-loss number almost nobody quotes is larger than either. A program losing a fifth of its conversions to cookie blocking has a bigger problem than one losing a tenth of its clicks to bots.
Affiliate Disclosure Rules and Enforcement
Enforcement moved from guidance to fines in 2025 and 2026, on 3 continents, with dollar amounts attached.
- United States: the FTC’s rule on consumer reviews took effect on 21 October 2024, banning fake or AI-generated reviews, sentiment-conditioned incentives, and undisclosed insider reviews, with civil penalties of $53,088 per violation. First warning letters went to 10 companies in December 2025. TruHeight received a $4 million judgment in July 2026, suspended on payment of $750,000
- European Union: a sweep of 576 influencers by the Commission and 22 national authorities found 97% posted commercial content and only 20% disclosed it systematically; 358 were flagged for follow-up
- United Kingdom: the Digital Markets, Competition and Consumers Act, in force from April 2025, lets the CMA fine up to 10% of global turnover without going to court. The first 5 investigations, including Autotrader and Just Eat, opened in March 2026
- Browser extensions: Chrome’s store policy has prohibited affiliate-code injection without a user benefit since March 2025
The EU figure is the one to remember. 4 in 5 influencers posting paid content were not labelling it consistently, in a market where the rules have existed for years. The gap between the rule and the behaviour is the enforcement opportunity, and regulators in 3 jurisdictions have now started to take it.
Affiliate Marketing in India
India has the highest commission rates of any major marketplace and the least measured market. The only industry-level estimate is 3 years old.
- Affiliate spend of about $331 million in 2023, projected to pass $420 million by 2025, making up 10% to 12% of digital marketing budgets against 15% in mature markets (IAMAI with Kantar)
- 84% of Indian online content publishers work with affiliate programs, with ecommerce, travel, financial services, and education the top categories (same report)
- Amazon.in pays 10% on apparel, shoes, and beauty; Flipkart pays 8% on fashion. Both pay 1% or less on phones
- EarnKaro reports more than 3 million users, over ₹40 crore paid out, and 200+ brands; Cuelinks reports 60,000+ publishers and 10 million clicks a month
The “$465 million in 2026” and “2% of the global market” figures that circulate for India come from aggregator blogs with no origin. Use the IAMAI number and say it is from 2023.
Affiliate Marketing Statistics That Are Not True
This field recycles a small set of numbers that have no source or a very old one. These are the ones you will meet most often.
95% of affiliate marketers fail in their first year. Traces to a 2008 forum post quoting an article directory. No study has ever produced it.
Affiliate marketing drives 16% of all ecommerce. A 2015 analysis by Custora, relayed by Business Insider, describing orders in its client base a decade ago. The measured 2024 figure from network data is 9.4%.
81% of advertisers and 84% of publishers run affiliate programs. A Forrester survey for Rakuten, fielded in 2015 among 150 large advertisers. Real, and 11 years old.
Amazon has 46% market share. A crawler counting scripts on websites, not revenue.
The average affiliate earns $8,038 a month. A self-selected mean with no median, from a 2024 survey whose page no longer exists.
Affiliate fraud costs $3.4 billion a year. A 2022 projection. The invalid-traffic rate it was built on has halved.
The pattern repeats: a number is published once with a year and a method, gets quoted without them, then quoted from the quote. If an affiliate statistic arrives without the year it describes, assume it is older than you would like.
The Limits of This Data
Affiliate marketing has no census and no regulator that counts it, so even the best figures here have edges.
- Network data covers networks. The PMA and APMA studies are built from the platforms that chose to participate. In-house programs, and Amazon, are outside them
- Platform disclosures are self-reported and undated. “In the last financial year” on a company page can mean 2 different years on 2 visits
- There is no earnings distribution anywhere. Every income figure is a mean from a self-selected sample, which is the least informative statistic possible for a cliff-shaped distribution
- Attribution defines the channel. An 11 to 1 return counts the sale after a cashback click the shopper had already decided to make. Change the attribution model and the return changes with it
- AI assistants publish nothing. The fastest-growing source of purchase influence reports no traffic, no attribution, and no payouts
None of that makes the picture unusable. The direction of each trend is far more trustworthy than any single decimal, and a statistic quoted to 2 decimal places in this field is a sign it was never read off a source.
Frequently Asked Questions
How big is the affiliate marketing industry?
US advertisers spent $12.42 billion on affiliate marketing in 2025 and are forecast to spend $13.81 billion in 2026, driving about $241 billion in ecommerce sales, according to eMarketer. The Performance Marketing Association, using data from 8 networks, measured $13.63 billion invested in 2024 producing $113 billion in sales. UK spend was £1.8 billion in 2025. Global figures are analyst estimates, not measurements.
How much do affiliate marketers make?
No network or regulator publishes a median affiliate income. The only survey is Authority Hacker’s 2024 poll of 2,270 self-selected respondents, which reported a mean of $8,038 a month with no median, and its page is now offline. Counted payouts are the better proxy: impact.com paid partners over $5 billion and Awin $1.4 billion in their last fiscal years, spread across hundreds of thousands of publishers, most of whom earn very little.
What is the Amazon affiliate commission rate?
Amazon.com pays 0% to 10% by category as of August 2026: 10% on luxury beauty, 4.5% on books and kitchen, 4% on apparel and all other categories, 3% on home and toys, 2.5% on PCs, 2% on TVs, 1% on grocery, and 0% on gift cards and wireless plans. The program average fell from about 9.25% in 2012 to 3.14% after the April 2020 cuts, and managed publishers reported further cuts of up to 50% in March 2026.
Is affiliate marketing still worth it with AI Overviews?
Spend is growing 11% a year while search clicks fall. Pew found users clicked a result on 8% of Google visits with an AI Overview versus 15% without, and Ahrefs measured a 58% drop in position-1 click-through on affected queries between 2023 and 2025. The growth is in loyalty, cashback, and creator partners, which now carry most transactions. Review sites that depend on ranking first are the part of the channel under pressure.
Which affiliate networks are the largest?
By disclosed scale: impact.com reports about $120 billion in partner-referred sales and $5 billion in payouts for the year to January 2026; Awin reports $19 billion in advertiser revenue and $1.4 billion paid to 1 million publishers; CJ reports over $16 billion in advertiser revenue. ShareASale merged into Awin in 2025. Amazon Associates, the largest program, has never disclosed its size.
How much affiliate traffic is fraud?
About 9.09% of affiliate-channel clicks were invalid across more than 2 billion clicks between January 2025 and March 2026, according to Opticks, down from 17% in CHEQ’s 2022 study. That compares with 15.9% for native ads and 2.18% for search. Tracking loss is the larger problem: Awin found 22% of conversions in a 25,000-sale sample were only visible through server-to-server tracking.
What are the rules for affiliate disclosure?
In the US, the FTC’s Endorsement Guides were revised in June 2023 and its fake reviews rule took effect on 21 October 2024 with penalties of $53,088 per violation; the first enforcement came in December 2025. In the UK, the Digital Markets, Competition and Consumers Act lets the CMA fine up to 10% of global turnover, with the first 5 investigations opened in March 2026. An EU sweep of 576 influencers found only 20% disclosing consistently.
How big is affiliate marketing in India?
IAMAI and Kantar estimated Indian affiliate spend at about $331 million in 2023, projected to exceed $420 million by 2025, making up 10% to 12% of digital marketing budgets. Amazon.in pays 10% on apparel, shoes, and beauty, 5.9% on books and toys, and 1% or less on phones as of August 2026. Flipkart pays 8% on fashion and 3% on electronics. EarnKaro reports more than 3 million users and ₹40 crore paid out.
Final Remarks
The story in this data is not that affiliate marketing is dying. Spend is up 49% in 3 years and still growing at 11%. The story is that the channel and the publisher who built it have come apart. The money moved to the last click before checkout and to the creator on camera, and the review article that used to sit between them lost half its search traffic to a summary that cites it and pays nothing.
That split changes what the statistics are for. A growing market figure says nothing about whether your model works inside it. The commission rate on your category, the share of your conversions that survive cookie blocking, and whether an AI Overview now sits on your best query: those are the numbers that decide your year. The market size never did.
Affiliate marketing is healthier than its traffic and more concentrated than its headlines. Know which side of that split you are publishing on.
Tell Google you want more of this.
Add Gatilab as a preferred sourceOne tap, and this site shows up more often in your own Top Stories, AI Overviews and AI Mode. Remove it any time.