
Attribution Models in Marketing: 7 Models Explained (2026 Guide)
Marketing attribution models assign credit for a conversion across the touchpoints that produced it. The model you pick determines which channel looks profitable, which campaign gets the budget renewal, and which channel gets cut. Pick the wrong marketing attribution model and you’ll defund the channel that actually drives revenue while doubling down on the one that closes deals already won. Seven marketing attribution models are worth knowing in 2026: last-click, first-click, linear, time decay, position-based (U-shaped), data-driven, and custom.
I’ve audited attribution setups for 23 ecommerce and SaaS clients over the last two years. The pattern is consistent: teams default to last-click because it’s the GA4 default, then complain that paid social doesn’t work. Last-click systematically underweights upper-funnel channels by 40 to 70 percent. Switching to data-driven attribution or a custom model usually rebalances spend in the first month and lifts blended ROAS 12 to 28 percent on the same budget.
Attribution models are accounting policies for marketing. They don’t change reality. They change which channel gets the credit, which means they change the budget. Treat the model choice with the same seriousness you’d treat any accounting decision.
What Marketing Attribution Models Are and Why They Matter
A marketing attribution model is a rule that distributes credit for a conversion across the marketing touchpoints a customer engaged with on the path to purchase. A user who saw a Facebook ad on Tuesday, clicked a Google Ad on Friday, opened an email on Monday, and bought via direct on Wednesday touched four channels. Attribution decides how much of the $400 sale belongs to each.
The model matters because budgets are allocated on the credit it assigns. If your model gives 100 percent credit to the last click (direct in this case), Facebook, Google Ads, and email all look like they did nothing. The CFO cuts the spend. The pipeline collapses. Six months later you discover the channels you cut were responsible for 60 percent of the demand all along.
Attribution affects three decisions every marketing team makes weekly:
- Channel budget split. Which channels get more spend next month and which get cut.
- Campaign optimization. Which campaigns inside a channel scale or pause based on apparent ROAS.
- Creative testing. Which creative variants get more impressions based on attributed conversion lift.
Attribution failure is one of the most common findings in our comprehensive website audits. Teams running last-click on multi-channel funnels are silently overspending on bottom-funnel and underspending on demand generation by margins large enough to explain stalled growth.
The 7 Marketing Attribution Models Explained
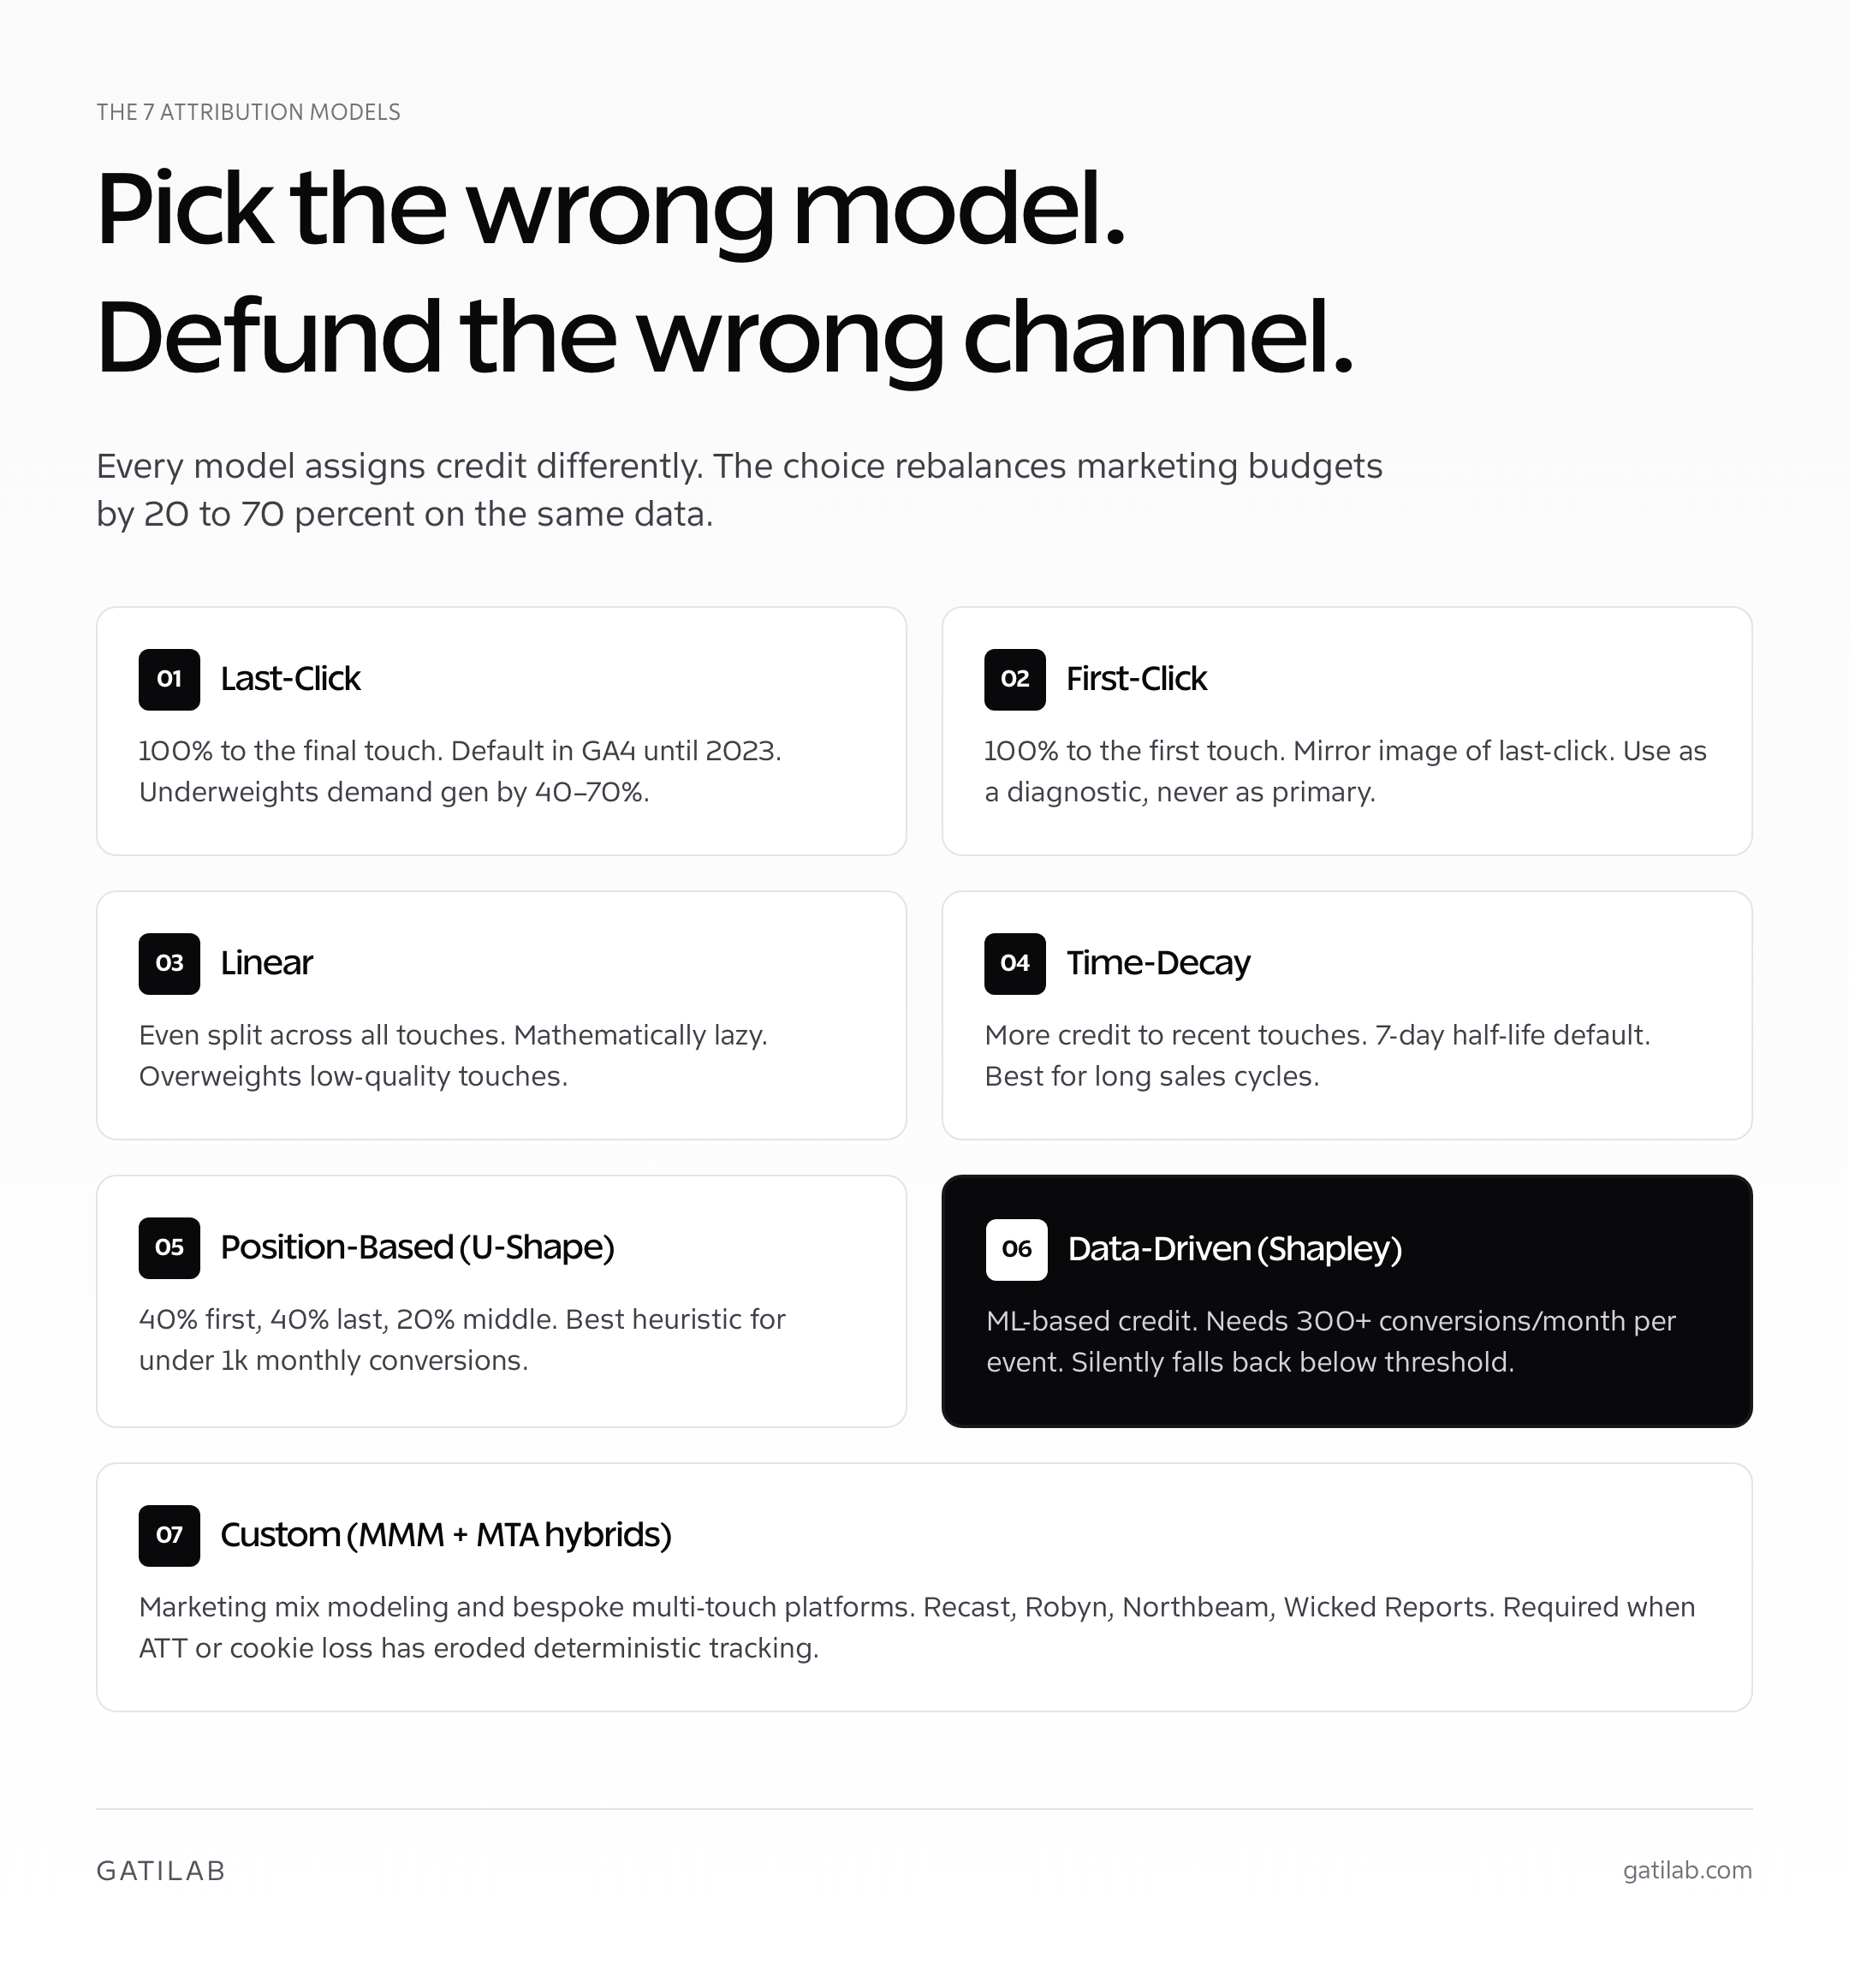
Seven marketing attribution models cover the realistic spread of credit-assignment rules in 2026. Three are single-touch (one channel gets all the credit). Four are multi-touch (credit is distributed). Each has a defensible use case and a destructive misuse pattern.
1. Last-Click Attribution
Last-click attribution gives 100 percent of the credit to the final touchpoint before conversion. The channel the user clicked right before they bought wins everything. It’s the default in most analytics platforms, including GA4 (until 2023’s data-driven default switch), most ad platform reports, and almost every mid-market dashboard.
It’s defensible only if you sell to one-touch funnels: impulse purchases, single-search-query conversions, and very short consideration cycles. Use it for a SaaS B2B funnel and you’ll cut your top-of-funnel paid social inside a quarter, then watch demand evaporate two quarters later.
2. First-Click Attribution
First-click attribution gives 100 percent of the credit to the first touchpoint that introduced the user to the brand. It’s last-click’s mirror image and has the opposite problem: it overweights demand-generation channels and underweights closing channels.
First-click is useful as a diagnostic comparison against last-click. If a channel looks profitable on first-click but invisible on last-click, it’s probably a demand-gen channel that needs different metrics (assisted conversions, view-through revenue, branded search lift). I never recommend first-click as the primary model. It’s a sanity-check view.
3. Linear Attribution
Linear attribution distributes credit evenly across every touchpoint. Four touchpoints, 25 percent each. Twelve touchpoints, 8.33 percent each. It’s the simplest multi-touch model and the closest analogy to “everything contributes equally.”
Linear is mathematically lazy but defensible as a starting position when you don’t have enough data to support data-driven attribution and don’t want to choose where the weight should sit. It systematically overweights low-quality touches: the random newsletter open, the navigational branded search. Use it as a comparison view, not the primary.
4. Time-Decay Attribution
Time-decay attribution assigns more credit to touchpoints closer to the conversion. The default decay is a 7-day half-life: a touch 7 days before purchase gets half the credit of a touch the day of purchase. Touches 14 days out get a quarter. Touches 21 days out get an eighth.
Time-decay is genuinely useful for long sales cycles where the most recent touches are likely the most causal. SaaS B2B with 60-day average sales cycles, ecommerce with 21-day consideration windows. It still underweights brand awareness work, but less aggressively than last-click.
5. Position-Based (U-Shaped) Attribution
Position-based attribution, also called U-shaped, gives 40 percent credit to the first touch, 40 percent to the last touch, and distributes the remaining 20 percent across the middle touches. The variant called W-shaped adds a third anchor (lead-conversion stage) at 30 percent each for first / lead / last with 10 percent across the middle.
Position-based is the best heuristic model when you can’t run data-driven attribution. It captures both demand-gen value and closing value, leaves the middle for nurture credit, and produces stable budget allocation decisions. I recommend it as the default for any team with multi-touch funnels and fewer than 1,000 conversions per month (which rules out data-driven).
6. Data-Driven Attribution (DDA)
Data-driven attribution uses machine learning to assign credit based on the actual contribution of each touchpoint, learned from your real conversion paths. GA4’s DDA uses a Shapley value approach, which is the cleanest mathematical solution for marginal-contribution attribution.
DDA is the right pick if you have enough data to feed it. Google’s published threshold for GA4 DDA is 300 conversions per conversion event over the last 30 days, with at least 3,000 events on conversion paths. Below that, the model falls back to last-click without warning. Many teams running DDA in GA4 are silently running last-click because they don’t meet the threshold.
7. Custom (Marketing Mix Modeling and Multi-Touch Hybrids)
Custom attribution covers everything bespoke: marketing mix modeling (MMM), multi-touch attribution platforms with custom rules, and hybrid models that blend deterministic touch-level data with statistical lift testing. MMM is making a comeback in 2024 to 2026 because cookie deprecation and ATT-driven signal loss have eroded the deterministic touch tracking that DDA depends on.
The serious players in custom attribution as of May 2026: Wicked Reports for ecommerce, Triple Whale for Shopify, Hyros for direct-response and info products, Northbeam for DTC, and pure-play MMM solutions like Recast or Meta’s open-source Robyn. Each has trade-offs. None is plug-and-play.
Pros and Cons of Each Marketing Attribution Model
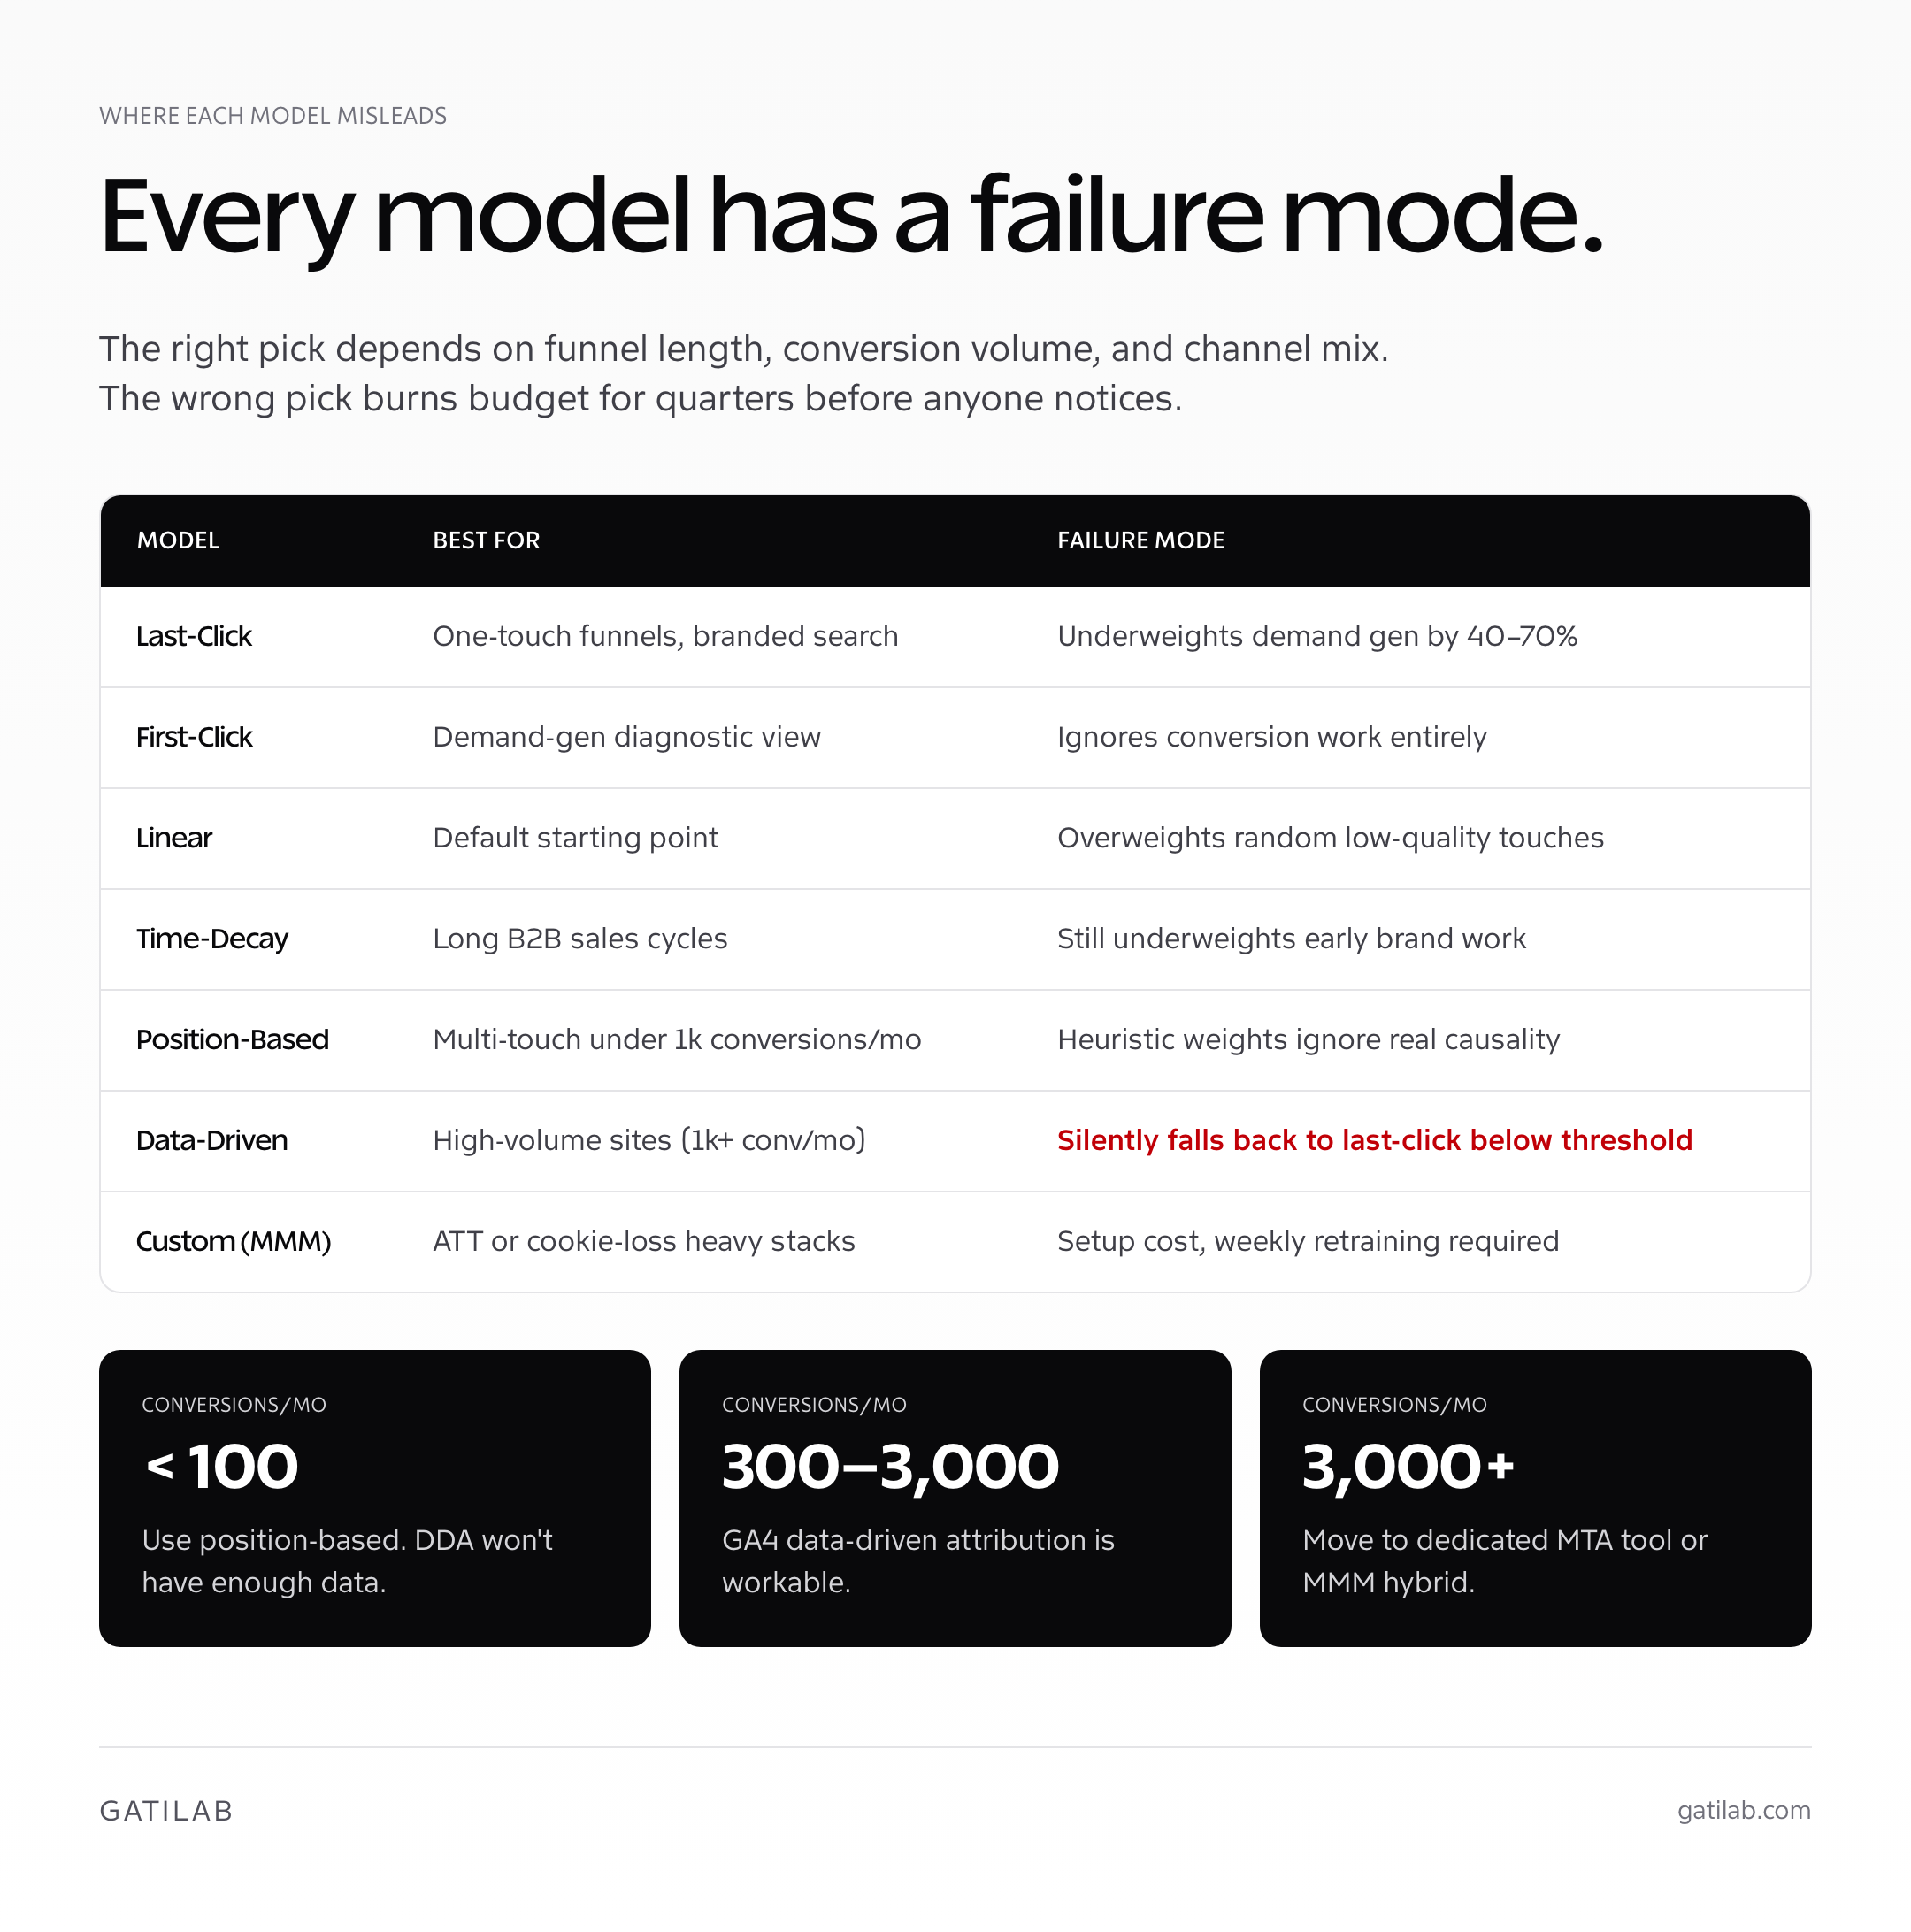
Every marketing attribution model has a defensible use case and a failure mode. The table below summarizes when each model fits and where it’ll mislead the team.
| Model | Best for | Failure mode |
|---|---|---|
| Last-click | One-touch funnels, branded search | Underweights demand gen by 40 to 70 percent |
| First-click | Demand-gen diagnostic view | Overweights top-of-funnel, ignores conversion work |
| Linear | Default starting point | Overweights random low-quality touches |
| Time-decay | Long sales cycles, B2B SaaS | Still underweights early brand work |
| Position-based | Multi-touch funnels under 1,000 monthly conversions | Heuristic fixed weights ignore real causal patterns |
| Data-driven | High-volume sites with 1,000+ monthly conversions | Silently falls back to last-click below threshold |
| Custom (MMM) | Multi-channel teams with ATT or cookie loss | Setup cost, weekly model retraining required |
If you take only one thing from this section: never run last-click as your primary model on a multi-touch funnel. The hidden cost will exceed the cost of any attribution platform you might evaluate.
How to Set Up GA4 Attribution
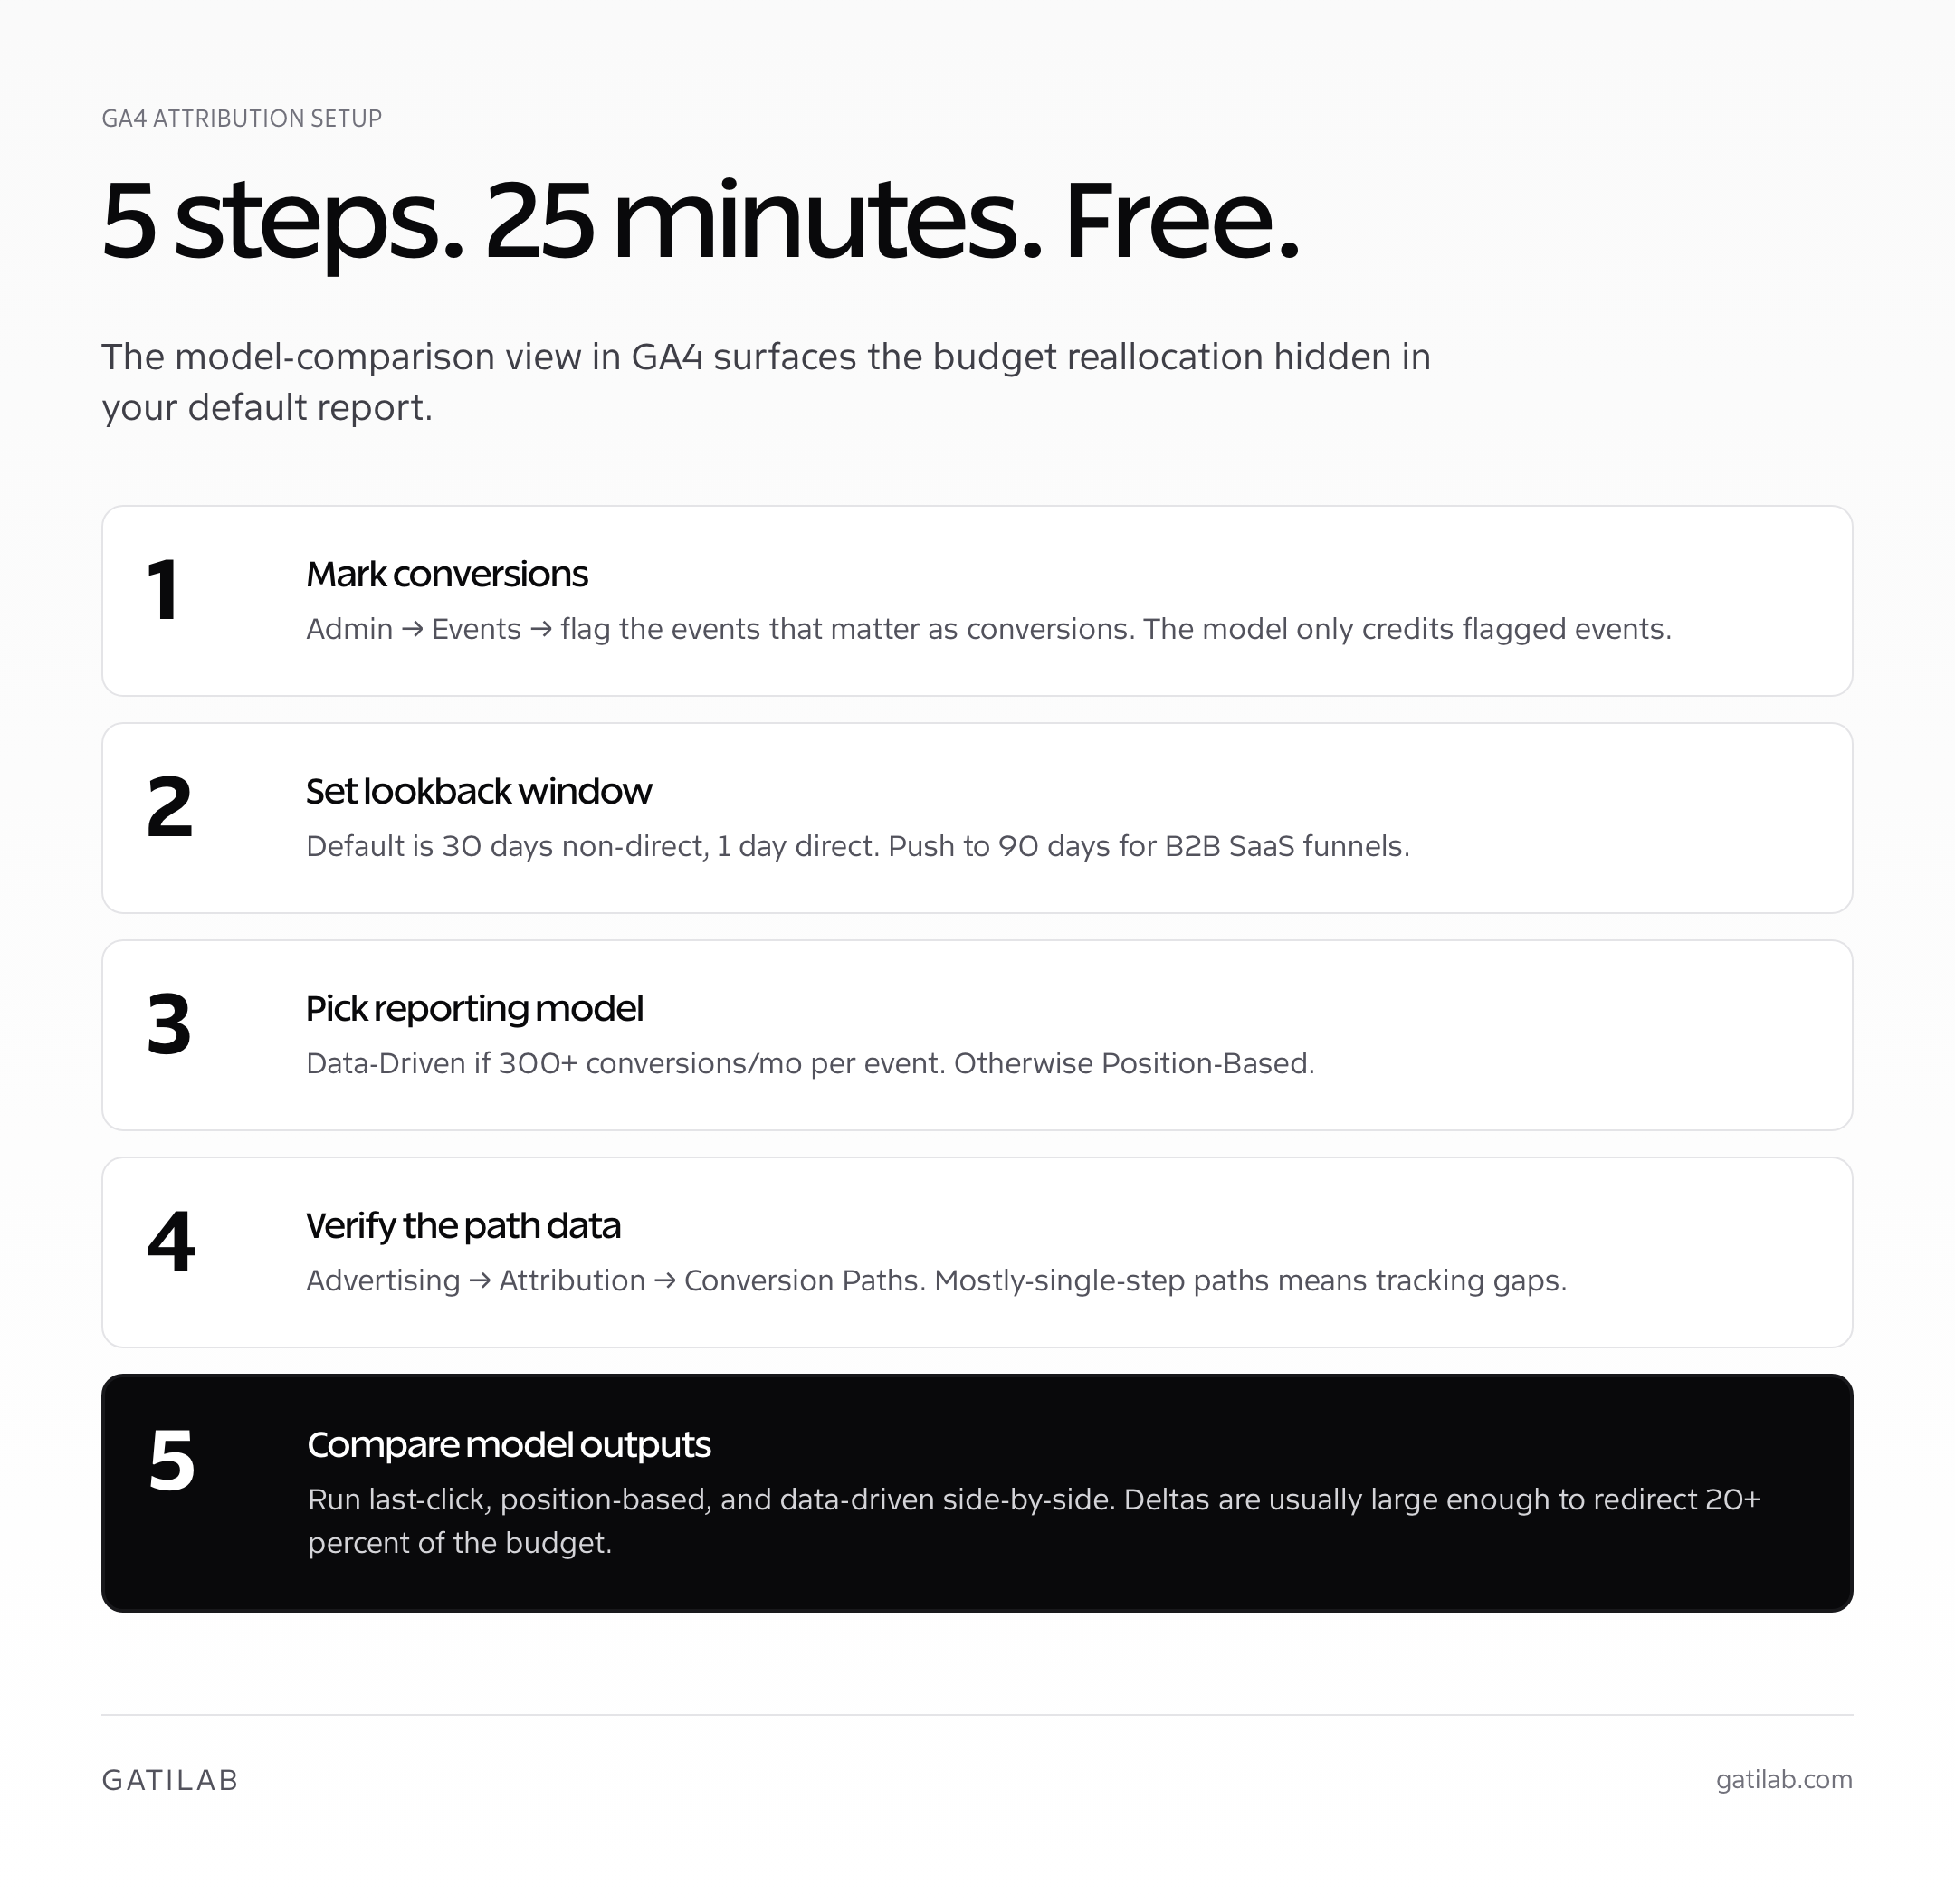
GA4 ships with three attribution models out of the box and lets you compare them in the Attribution section under Advertising. Setting up GA4 attribution properly takes 25 minutes and unblocks the model-comparison view that most teams never realize they have.
- Confirm conversion events are firing. Admin → Events → mark the relevant events as conversions. The model only assigns credit to events flagged as conversions.
- Set the lookback window. Admin → Attribution Settings. The default is 30 days for non-direct conversions and 1 day for direct. For B2B SaaS, push the non-direct window to 90 days.
- Pick the reporting model. GA4 defaults to data-driven if you have enough data, then falls back to last-click. Change in Attribution Settings: Paid and Organic Channels = Data-Driven, Cross-Channel = Data-Driven (or Position-Based if you don’t meet the volume threshold).
- Verify the path data. Advertising → Attribution → Conversion Paths. If the report shows mostly single-step paths, you have tracking gaps that data-driven attribution can’t fix.
- Compare model outputs. Advertising → Attribution → Model Comparison. Run the same conversion against last-click, position-based, and data-driven side-by-side. The differences are usually large enough to redirect 20+ percent of the budget.
The most common GA4 attribution mistake I see in audits is running data-driven attribution on a property below 300 conversions per event per month. The platform silently falls back to last-click and shows the same numbers as the legacy view. The fix is either generate more data, switch to position-based explicitly, or move attribution off GA4 to a dedicated platform.
Best Marketing Attribution Tools (2026 Comparison)
Five attribution tools cover almost every team that needs to move beyond GA4: Wicked Reports, Triple Whale, Hyros, Northbeam, and Recast. Each fits a different revenue range and channel mix.
GA4 (Free Default)
GA4’s data-driven attribution is free and good enough for most sites under $5M annual revenue with deterministic tracking and 1,000+ monthly conversions. The limit is GA4’s blind spot on offline conversions, ATT-affected iOS traffic, and dark social. If your channel mix is mostly Google Ads, Meta on web, organic search, and email, GA4 is fine. If you’re spending on TikTok, podcasts, OOH, or anything view-through, you’ll outgrow it inside two quarters.
Wicked Reports
Wicked Reports specializes in ecommerce attribution with full lifetime customer value visibility, not just first-purchase. Pricing starts at $499/mo for the Scale plan covering up to $250k in tracked monthly revenue, scaling to $999/mo at $2.5M tracked monthly revenue, and Enterprise quote-only. Best for ecommerce brands at $1M to $50M annual revenue.
Triple Whale
Triple Whale is the Shopify-native attribution and analytics suite. Pricing is vendor-published quote-only, with most published deals starting at $400/mo for the Growth plan. Triple Whale’s edge is direct integration with Shopify, Meta, Google, TikTok, and Klaviyo, plus an AI insights layer (Moby) that surfaces budget reallocation recommendations.
Hyros
Hyros is built for direct-response advertisers, info-products, and high-ticket coaching businesses. Pricing is vendor-published quote-only, typically $999 to $5,000 per month based on tracked ad spend. Hyros’s claim is server-side tracking that recovers 30+ percent of the conversions iOS 14.5+ broke. Useful in the right vertical, overkill in most.
Northbeam
Northbeam is the DTC attribution platform of choice for brands at $5M+ annual revenue. Pricing starts at $1,500/mo for the Starter plan. Northbeam combines multi-touch attribution with weekly MMM-style modeling, which is the right hybrid for ecommerce teams running 8+ channels.
| Tool | Starting price | Best for |
|---|---|---|
| GA4 (free) | Free | Single-channel or low-volume sites |
| Wicked Reports | $499/mo | Ecommerce $1M to $50M revenue |
| Triple Whale | ~$400/mo (vendor-published) | Shopify-native brands |
| Hyros | ~$999/mo (vendor-published) | Direct-response, info products |
| Northbeam | $1,500/mo | DTC brands $5M+ revenue |
If your traffic is mostly organic and you’re trying to figure out where to spend marginal budget, our content cluster strategy guide covers how to amplify the SEO channel before adding paid attribution complexity.
How to Choose the Right Marketing Attribution Model
The right marketing attribution model is the one that matches your funnel length, conversion volume, and channel mix. Three questions narrow the choice fast.
- How many touchpoints does the average customer have? Under 2: last-click is fine. 2 to 5: position-based. 5+: data-driven or MMM.
- How many conversions do you produce per month? Under 100: position-based (DDA won’t have enough data). 300 to 3,000: GA4 DDA is workable. 3,000+: dedicated MTA tool or MMM.
- How much of your traffic is iOS or anonymous? Under 30 percent: deterministic models work. Above 30 percent: you need server-side tracking, MMM, or both.
Attribution model perfectionism is a budget killer. The best model is the one your team will actually use to make weekly budget decisions. A “wrong” model that drives consistent reallocation beats a “right” model that’s too complex to run.
Common Attribution Setup Mistakes
Three errors account for the bulk of attribution model failures I’ve audited. Each is fixable in under a week.
- Not stripping UTMs on direct traffic. Without consistent UTM tagging on every paid touchpoint, attribution defaults to “Direct” or “Organic” for huge chunks of traffic. Run a weekly check that 100 percent of paid clicks have utm_source and utm_medium populated.
- Mixing attribution windows across reports. Marketing dashboards reporting Google Ads on a 30-day click window and Meta on a 7-day click + 1-day view will systematically overstate Google and understate Meta. Pick one window across all reports.
- Trusting the default ad-platform attribution. Each ad platform reports its own attribution against its own conversions. The numbers always sum to more than 100 percent of actual conversions because every platform claims credit. Always reconcile to a single source of truth (GA4, your MTA, or your warehouse).
When attribution is unclear, the funnel itself usually needs work first. See our guide to conversion-optimized web pages for the page-level fixes that unblock attribution before you spend on a new platform.
My Marketing Attribution Models Verdict
For most teams in 2026, the right starting marketing attribution model is position-based in GA4 plus a quarterly comparison view against data-driven. Make budget decisions weekly using position-based, then sanity-check quarterly against DDA, last-click, and first-click. The deltas tell you where the model is mistaken and which channel needs deeper investigation.
Above $5M revenue with 5+ active paid channels, you outgrow GA4. Move to Northbeam, Wicked Reports, or Triple Whale based on your stack. Above $50M, layer in MMM with Recast or Meta’s Robyn so you can model brand and offline channels GA4 can’t see. The goal isn’t perfect attribution. The goal is a model coherent enough to make defensible budget decisions every week without re-litigating the methodology.
Marketing Attribution Models for B2B vs Ecommerce
The right marketing attribution model varies sharply between B2B and ecommerce funnels. The variables that drive the choice are sales-cycle length, channel mix, and how much of the conversion path is anonymous.
B2B SaaS marketing attribution models
B2B SaaS funnels typically have 7 to 30 touchpoints across 30 to 180 days, mixing paid search, content, email, retargeting, sales touches, and demo bookings. Last-click attribution destroys B2B SaaS budgets because it credits the demo-request form (which everyone clicks just before booking) and starves the demand-generation channel that produced the lead three months earlier.
The right marketing attribution models for B2B SaaS are W-shaped (30 percent first / 30 percent lead conversion / 30 percent last / 10 percent middle), time-decay with a 60-day half-life, or full data-driven attribution if conversion volume permits. W-shaped is the safe heuristic when DDA falls back to last-click. Above $20M ARR, layer in marketing mix modeling against the W-shaped MTA view to capture brand and offline channels.
Ecommerce marketing attribution models
Ecommerce funnels run shorter (3 to 30 days for considered purchases, hours for impulse) and skew heavier on paid social, paid search, and influencer / affiliate channels. ATT-driven signal loss has been the defining challenge since iOS 14.5: 25 to 45 percent of iOS conversions are unattributable on standard pixels.
The right marketing attribution models for ecommerce are GA4 data-driven attribution paired with a server-side Conversions API setup for Meta and Google, plus a dedicated multi-touch attribution platform (Wicked Reports, Triple Whale, Northbeam) above $5M annual revenue. Below $5M, GA4 DDA is fine if you have 1,000-plus monthly transactions per conversion event.
For ecommerce teams running paid acquisition heavily, the attribution model decision is downstream of the data quality decision. Without server-side tracking, no marketing attribution model produces clean numbers. Fix tracking first.
Building a Marketing Attribution Reporting Stack
The best marketing attribution stack is the smallest one your team will actually use weekly. Three layers cover almost every scenario.
- Source-of-truth platform. One platform makes the canonical conversion call. GA4 for most teams. A dedicated MTA tool above $5M revenue. An MMM solution above $50M revenue. Everyone reports against the same number.
- Channel-level dashboards. Looker, Domo, or a warehouse-driven BI tool reads from the source of truth and renders per-channel views. Marketing teams update budgets weekly using these dashboards, not the platform native reports.
- Quarterly model comparison. Run the same conversions through last-click, position-based, and data-driven models side-by-side every 90 days. The deltas reveal where the model needs adjustment and which channel deserves a deeper investigation.
Marketing attribution models exist to inform budget decisions, not to be perfect. The team that ships clean weekly budget reallocation against a slightly imperfect model beats the team that argues about methodology while overspending on the wrong channel for six quarters. Pick a model, document the choice, run it for 90 days, then revisit.
What are attribution models in marketing?
Attribution models in marketing are rules that assign credit for a conversion across the marketing touchpoints a customer engaged with on the way to purchase. The model determines which channel looks profitable and which gets the budget renewal. Pick the wrong model and you’ll defund the channel that actually drives revenue while doubling down on the one that closes deals already won.
What is the difference between last-click and first-click attribution?
Last-click attribution gives 100 percent of credit to the final touchpoint before conversion. First-click gives 100 percent to the first touchpoint that introduced the user to the brand. Both are single-touch and produce opposite biases: last-click underweights demand-generation channels; first-click underweights closing channels. Neither is appropriate as the primary model on a multi-touch funnel.
Which attribution model is best for B2B SaaS?
For B2B SaaS with 60-day-plus sales cycles and 5+ touchpoints per conversion, the best attribution model is data-driven (DDA) if you have 1,000+ monthly conversions per event, or position-based (U-shaped or W-shaped) if you don’t. Time-decay is a workable third option. Last-click systematically underweights the demand-gen and nurture work that B2B SaaS funnels depend on.
How does GA4 data-driven attribution work?
GA4 data-driven attribution uses a Shapley-value machine learning model to assign credit based on the actual contribution of each touchpoint, learned from your real conversion paths. Google requires 300 conversions per conversion event over 30 days plus 3,000 events on conversion paths. Below that threshold, GA4 silently falls back to last-click without warning.
What is multi-touch attribution?
Multi-touch attribution distributes credit for a conversion across multiple touchpoints rather than assigning it all to one (single-touch). The four common multi-touch models are linear (even split), time-decay (recent touches weighted), position-based (first and last weighted), and data-driven (ML-based). Multi-touch is required when the average customer has more than 2 touchpoints before converting.
Which attribution tool is best for ecommerce?
For ecommerce, the best attribution tools are Wicked Reports for $1M to $50M brands needing customer LTV visibility, Triple Whale for Shopify-native stacks, and Northbeam for DTC brands above $5M annual revenue. GA4’s free data-driven attribution covers brands under $5M with deterministic tracking and clean Google/Meta-heavy channel mixes.
How long should an attribution lookback window be?
The default GA4 attribution lookback window is 30 days for non-direct conversions and 1 day for direct. For B2B SaaS with longer sales cycles, push the non-direct window to 90 days. For ecommerce, 30 days usually captures the full consideration window. Setting the wrong lookback window will systematically under-credit upstream channels that introduced the visitor weeks before conversion.
What is marketing mix modeling?
Marketing mix modeling (MMM) is a top-down statistical method that estimates the contribution of marketing channels using aggregate data (spend, impressions, sales) rather than per-user touchpoint tracking. MMM has surged back since 2022 because cookie deprecation and ATT-driven signal loss have eroded the deterministic touch tracking that DDA depends on. Tools include Recast, Meta’s open-source Robyn, and Northbeam’s hybrid layer.
Why does attribution data not match between platforms?
Attribution data doesn’t match between platforms because each ad platform reports conversions against its own attribution rules and lookback windows. Google Ads reports last-click on a 30-day window; Meta reports 7-day click plus 1-day view by default; TikTok defaults to a 7-day click. The numbers always sum to more than the actual conversions because every platform claims overlapping credit. Always reconcile to a single source of truth.
How do I choose between attribution models?
Choose an attribution model based on funnel length, monthly conversion volume, and channel mix. Under 100 conversions per month: position-based. 300 to 3,000: GA4 data-driven. 3,000-plus across 5-plus channels: dedicated MTA tool or marketing mix modeling. If iOS or anonymous traffic exceeds 30 percent of your audience, you also need server-side tracking or MMM regardless of conversion volume.
Tell Google you want more of this.
Add Gatilab as a preferred sourceOne tap, and this site shows up more often in your own Top Stories, AI Overviews and AI Mode. Remove it any time.