
Content Marketing ROI: How to Measure It Without Fooling Yourself (2026)
Content marketing ROI is the revenue your content generates minus what it cost, divided by what it cost. The formula takes ten seconds. The measurement takes a working attribution setup, a 12-to-18 month horizon, and the discipline to ignore metrics that only look like results. A good benchmark for B2B: 3:1 return within 18 months, climbing well past that as content compounds.
I report content ROI to clients every month, and the number one thing I’ve learned building those reports: most content programs don’t have an ROI problem. They have a measurement problem stacked on a patience problem. Only 36% of marketers can accurately measure content ROI (Content Marketing Institute’s own research keeps finding this), which means most budget decisions in this industry are made half-blind.
Verdict: measure content marketing ROI at the pipeline level (leads, opportunities, closed revenue), not the traffic level. Judge nothing before month six, expect breakeven around months 9 to 12, and expect the curve to bend hard upward after that. If you need positive ROI inside a quarter, spend the money on ads instead… content is an asset class, not a coupon.
What Is a Good Content Marketing ROI?
A good content marketing ROI is 3:1 or better, meaning every dollar spent returns three in attributable revenue, and top B2B programs clear 4:1. Channel benchmarks compiled by First Page Sage put SEO and thought-leadership content at 748% ROI over three years, ahead of email at 261% and webinars at 213%. Those numbers look inflated until you notice the time frame. Content ROI is a compounding curve, not a monthly rate.
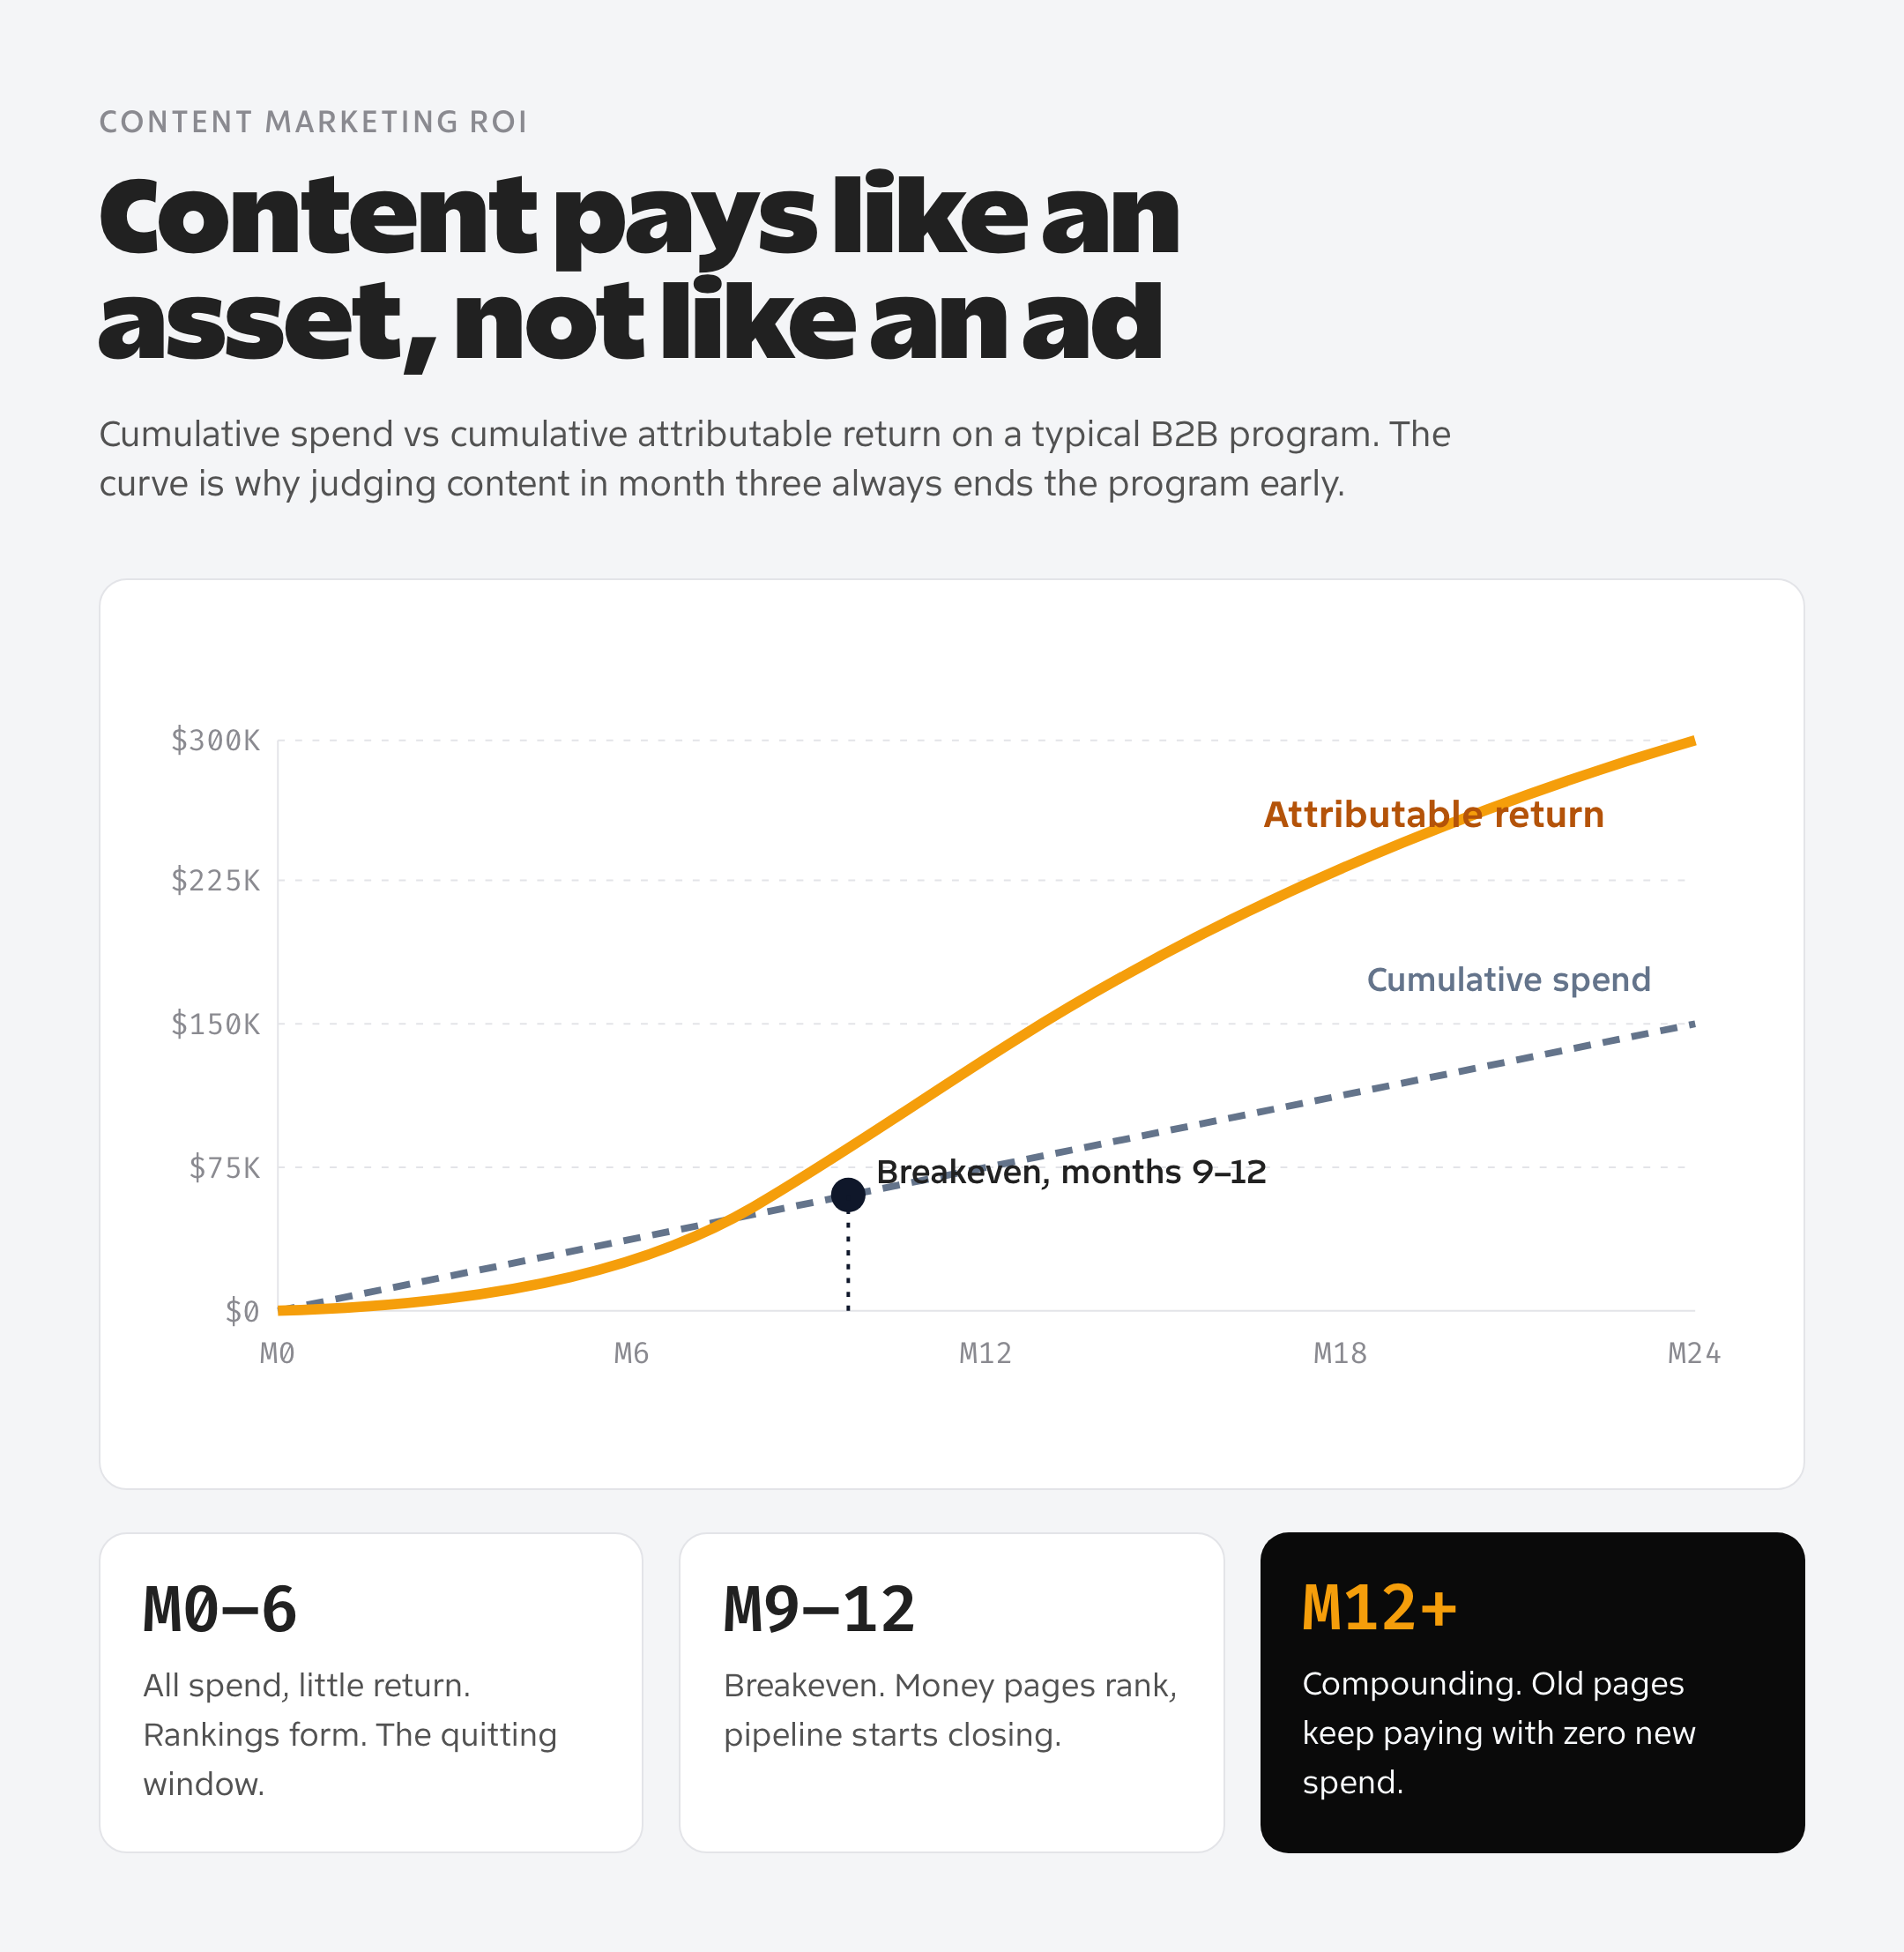
The same article that returns 0.4:1 at month six can sit at 6:1 at month twenty-four, because the production cost happened once and the traffic keeps arriving. That’s the asymmetry paid channels can’t offer: ads stop when the spend stops. My oldest ranking article still sends leads eight years after I wrote it (I’ve rewritten it twice since, which counts as maintenance cost, about 20% of the original spend each time).
Anchor your expectations to the horizon, not the headline number: 12 to 18 months to positive ROI is normal, and the 8.6-month median CAC payback that healthy B2B SaaS companies report includes all channels, with paid pulling the average down and content pulling the tail up.
The Content Marketing ROI Formula (With a Worked Example)
ROI = (attributable revenue − content investment) ÷ content investment × 100. Every term hides a decision, so here’s the whole thing worked through with numbers from a typical mid-size B2B program:
- Content investment: $5,000/month subscription + $500 tools + 10 internal hours at $75 = $6,250/month, $75,000 over 12 months
- Attributable revenue: 4,200 organic leads-page visits → 210 leads (5% conversion) → 25 opportunities → 8 customers at $28,000 average LTV = $224,000
- ROI: ($224,000 − $75,000) ÷ $75,000 = 199%, roughly 3:1, at the 12-month mark
Two honest caveats on that math. First, LTV-based ROI counts revenue you haven’t collected yet; if your finance team wants recognized revenue only, use first-year contract value and accept a smaller number. Second, ‘attributable’ is doing heavy lifting in that formula, and attribution is where most content ROI claims quietly fall apart. More on that below.
Content Marketing Metrics That Matter (and the Vanity Metrics That Don’t)
The metrics worth reporting are the ones a CFO can follow to money: qualified leads, pipeline created, closed revenue, and cost per acquisition by channel. Vanity metrics are the ones that go up and to the right without anyone buying anything. The industry runs on the second kind because they’re easier to produce:
| Report this | Why it matters | The vanity twin to retire |
|---|---|---|
| Organic conversions (demo, trial, contact) | Direct line to pipeline | Pageviews |
| Pipeline value from content-touched deals | Ties content to revenue | Social shares |
| Keyword rankings on money pages | Leading indicator of pipeline | Rankings on info-only keywords |
| Assisted conversions (content in the path) | Captures content’s middle-funnel work | Time on page |
| Cost per SQL from organic | Comparable against paid CAC | Follower growth |
Pageviews aren’t useless, they’re diagnostic. They tell you whether the top of the funnel is filling. They just don’t belong in an ROI conversation, and a provider who leads their monthly report with traffic charts is answering a question nobody asked. I’ve written before about how SEO ROI gets measured and proven, and the same rule holds here: if a metric can’t be walked to revenue in two steps or fewer, it’s decoration.
How to Measure Content Marketing ROI Step by Step
You can build a defensible measurement stack in an afternoon with GA4, Google Search Console, and your CRM. The steps, in the order I set them up for every client:
- Define conversions in GA4: demo requests, trial signups, contact forms, newsletter joins. Assign realistic values to each (a demo request isn’t revenue, but it has an expected value; use close rate × average deal size).
- Tag every content URL group: blog, guides, comparison pages, case studies. GA4’s content groups make per-format ROI visible instead of one blended blur.
- Capture first-touch and last-touch source in your CRM: a hidden form field with the landing page and referrer costs nothing and settles arguments later.
- Pull GSC data monthly: impressions and clicks by page tell you which content earns search demand before conversions show up. Leading indicator, not the verdict.
- Reconcile quarterly against closed-won deals: ask sales which deals touched content (they know), and compare against what attribution claims. The gap between those two numbers is your measurement error, and it’s usually 30 to 50 percent.
That last step matters more than the tooling. 56% of B2B marketers say they can’t attribute ROI to content efforts (per Sona’s 2026 benchmark roundup), and the fix isn’t better software. It’s accepting that attribution is an estimate, then bracketing the estimate from two directions: model-reported revenue on one side, sales-confirmed influence on the other. The truth lives between.
Why Attribution Lies About Content
Every attribution model undercounts content, because content does its best work before the tracked click. The prospect reads four articles over three months, then Googles your brand name and converts on a ‘direct’ visit. Last-touch hands the win to your homepage. First-touch hands it to whatever they happened to read first. Neither saw the middle.
I’ve compared the models side by side in my guide to marketing attribution models, so here’s just the operational takeaway: use position-based attribution for reporting, then add two unmodeled checks, branded search volume growth (GSC shows it free) and the ‘how did you hear about us’ form field. When those two rise while content ships, content is working, whatever the model says. Self-reported attribution routinely credits content with 2 to 3x what click models show.
Setting Content Marketing Goals That Survive a Board Meeting
Content marketing goals should be pipeline numbers with dates, not adjectives. ‘Increase brand awareness’ dies in a board meeting. ‘Generate $400K in content-sourced pipeline by Q4 at under $150 per SQL’ survives, because it can fail, and a goal that can’t fail isn’t a goal. The structure I use for every engagement:
- One revenue goal: content-sourced or content-influenced pipeline per quarter
- Two leading indicators: organic conversions/month and money-page rankings, reviewed monthly
- One efficiency bound: cost per SQL ceiling so scale doesn’t hide waste
- One kill criterion: the result that triggers a strategy change (mine: zero top-20 target rankings by month five)
Notice what’s missing: publishing volume. Articles-per-month is an input, and putting an input in the goals list is how teams end up celebrating 48 published posts and zero pipeline. The 73% of B2B marketers with a documented strategy (CMI’s 2026 figure) mostly document topics and calendars… the ones who beat their targets document the numbers above.
How to Make Content Actually Drive Action
Content drives action when every piece has one job and one next step. Most content drives nothing because it was built to ‘cover a topic,’ and topic coverage converts nobody. The mechanics that move the needle, ranked by how often they’re missing in the programs I audit:
- BOFU pages first: comparison, alternatives, pricing-explainer pages convert 5 to 15x better than informational posts. Build them before the thought leadership.
- One CTA per piece, matched to intent: a how-to article earns a template download, not a demo request. Escalate the ask as intent rises.
- Internal links from every informational post to a money page: descriptive anchors, placed where the reader has just gotten value.
- Proof near the ask: a specific number or named client within one scroll of the CTA lifts action rates more than any button color test I’ve run.
- Refresh winners: a post at position 6 refreshed to position 3 doubles clicks with zero new URLs. Refreshes routinely beat new posts on ROI per hour.
If you’re building the strategy layer from scratch, the sequencing logic in my SEO content strategy framework covers which pages to build in which order, and it pairs with the subscription-model math in my breakdown of content marketing as a service if you’re deciding whether to run this in-house or buy it.
Content ROI by Format: Where the Returns Concentrate
Formats don’t return equally, and the spread is wider than most budgets admit. Comparison and alternatives pages produce the highest revenue per word on every program I’ve measured; top-of-funnel explainers produce the least, and video sits wherever your distribution sits. Directionally, across client programs:
| Format | Typical job | ROI reality |
|---|---|---|
| Comparison / alternatives pages | Capture in-market buyers | Highest revenue per page; small search volume, huge intent |
| Case studies | Close support, sales enablement | Rarely ranks, converts everywhere it’s linked; measure influence, not traffic |
| How-to / SEO articles | Fill the funnel, earn links | Volume play; ROI arrives via internal links to money pages |
| Original research / data posts | Earn links and citations | Expensive once, compounds hardest; also the format AI engines quote most |
| Webinars | Mid-funnel acceleration | 213% benchmark ROI; decays fast unless repurposed into posts and clips |
The allocation mistake I see most: 70% of budget on how-to articles because they’re easy to brief, 10% on the BOFU pages that pay for everything. Flip that ratio for two quarters and the ROI conversation changes tone completely.
How AI Search Changes Content ROI Math in 2026
AI Overviews and chat assistants now answer a chunk of informational queries without a click, which cuts traffic to exactly the content that never converted well anyway. Zero-click results have pushed informational CTR down hard (multiple 2026 studies put the drop at 30 to 60 percent on queries with AI Overviews), while high-intent commercial queries still send clicks. The ROI implication is almost convenient: the formats losing traffic are the low-ROI ones, and the BOFU pages that make money are the ones AI engines still route buyers toward.
Two adjustments worth making now. First, track AI visibility alongside rankings: I pull LLM mention data through DataForSEO’s API monthly to see which client pages ChatGPT and Perplexity actually cite (the overlap with Google’s top 10 is smaller than you’d guess… roughly half the cited pages on queries I track sit outside position five). Second, treat ‘cited by AI with no click’ as an awareness impression in your model, because prospects increasingly arrive later as branded search. Branded search growth just became an even more important line in the ROI report.
Content Marketing ROI: FAQ
The questions that come up in every quarterly review, answered without the hedging:
How do you calculate content marketing ROI?
ROI = (attributable revenue minus content investment) divided by content investment, times 100. Count all costs (production, tools, internal hours) and use pipeline or LTV-based revenue with a stated attribution model. State the time window; content ROI at 6 months and 24 months are different numbers.
What is a good content marketing ROI?
3:1 within 12 to 18 months is solid for B2B; top programs reach 4:1 or higher. Multi-year benchmarks run far higher (First Page Sage puts SEO and thought-leadership content near 750% over three years) because content compounds after the production cost is sunk.
How long does content marketing take to show ROI?
Expect first rankings in 3 to 6 months, breakeven around months 9 to 12, and compounding returns from month 12 onward. Judging content ROI at month three is measuring a sapling with a lumber scale.
What are vanity metrics in content marketing?
Metrics that rise without connecting to revenue: pageviews, social shares, follower counts, time on page. They’re fine as diagnostics. They become vanity metrics the moment they headline an ROI report.
Which content marketing metrics should I report monthly?
Organic conversions, pipeline value from content-touched deals, money-page rankings, assisted conversions, and cost per SQL. Add branded search growth quarterly; it’s the cleanest unmodeled signal that content is building demand.
Why is content marketing ROI so hard to measure?
Because content works before the tracked click. 56% of B2B marketers can’t attribute content ROI, and click-based models miss the reading that happens across weeks. Bracket model data with sales-confirmed influence and self-reported attribution instead of trusting any single number.
Is content marketing worth it compared to paid ads?
Different jobs. Paid delivers fast, linear, rented results; content delivers slow, compounding, owned results. Under a 6-month horizon or below $2,000/month, choose ads. Past 12 months with real LTV behind each customer, content’s unit economics win.
The Bottom Line on Content ROI
Content marketing ROI rewards exactly two behaviors: measuring at the pipeline level and waiting long enough for the compounding to show. Build the GA4-plus-CRM stack in an afternoon, report five metrics a CFO can follow to money, bracket your attribution instead of believing it, and hold the program to 3:1 by month eighteen.
And when the traffic chart looks amazing in month four while the pipeline column reads zero… believe the pipeline column. It’s the only one that pays for month five.
Tell Google you want more of this.
Add Gatilab as a preferred sourceOne tap, and this site shows up more often in your own Top Stories, AI Overviews and AI Mode. Remove it any time.