
Google Search Console Keyword Ranking: How to Read Position Data
Google Search Console keyword ranking is the average position your URL holds for a query in Google’s organic results, calculated as the mean of every impression where Search Console saw your link inside the top 100 listings during the date range you selected. It is not your live rank, it is not a daily snapshot, and it is not the number a third-party rank tracker shows you. Once you understand what that one number actually represents, you can stop arguing with it and start using it to find rankings that are within reach.
I have been pulling Search Console position data on client sites since 2015. The same misreading shows up over and over: a founder sees position 14, opens an incognito tab, sees position 6, and tells me Search Console is broken. It isn’t broken. It is averaging across countries, devices, personalised results, SERP features, and queries that didn’t even render a clean ten blue links. This guide explains exactly how to read the number, how to filter it down to something useful, and how to use BigQuery exports when the dashboard hides too much.
Where Google Search Console keyword ranking actually lives
The Google Search Console keyword ranking number lives in one place: Performance > Search results > Average position. Toggle the “Average position” tile on, switch the table to the Queries tab, and every row shows the average rank for that query during your selected date range. Below the tile you get a daily line graph of average position across all queries combined. That is the entire surface for ranking data inside the UI.
Two limits to bake into your head before you do anything else. First, the Performance report only shows queries you received at least one impression for. If your URL ranks at position 87 but no one searched for that exact query in your date range, it will not appear. Second, the report caps at roughly 1,000 rows per export through the UI. If you want every query for a large site, the only way out is the BigQuery bulk data export, which I cover later.
Average position is a weighted mean, not your real rank
Average position is calculated for every impression Search Console logged during your date range, then divided by the impression count. If your page appeared at position 4 for one impression and position 18 for nine impressions, your average position is 16.6, not 11. Google weights this by impressions, not by unique queries, so a single high-volume query can drag the number up or down by several places.
The average is also flattened across every country, device, and SERP feature your URL appeared in. If you rank position 3 on desktop in the United States and position 22 on mobile in India, the average will sit somewhere in the middle and feel wrong on both ends. Filter aggressively before you read the number, otherwise you are interpreting noise.
Search Console only logs an impression when your URL was rendered on a SERP page the user actually saw. If a result lived on page 4 and the user never scrolled there, no impression, no rank data. That is why low-volume queries swing wildly week to week.
Position 1-3 vs 4-10 vs 11-20: where to spend your time
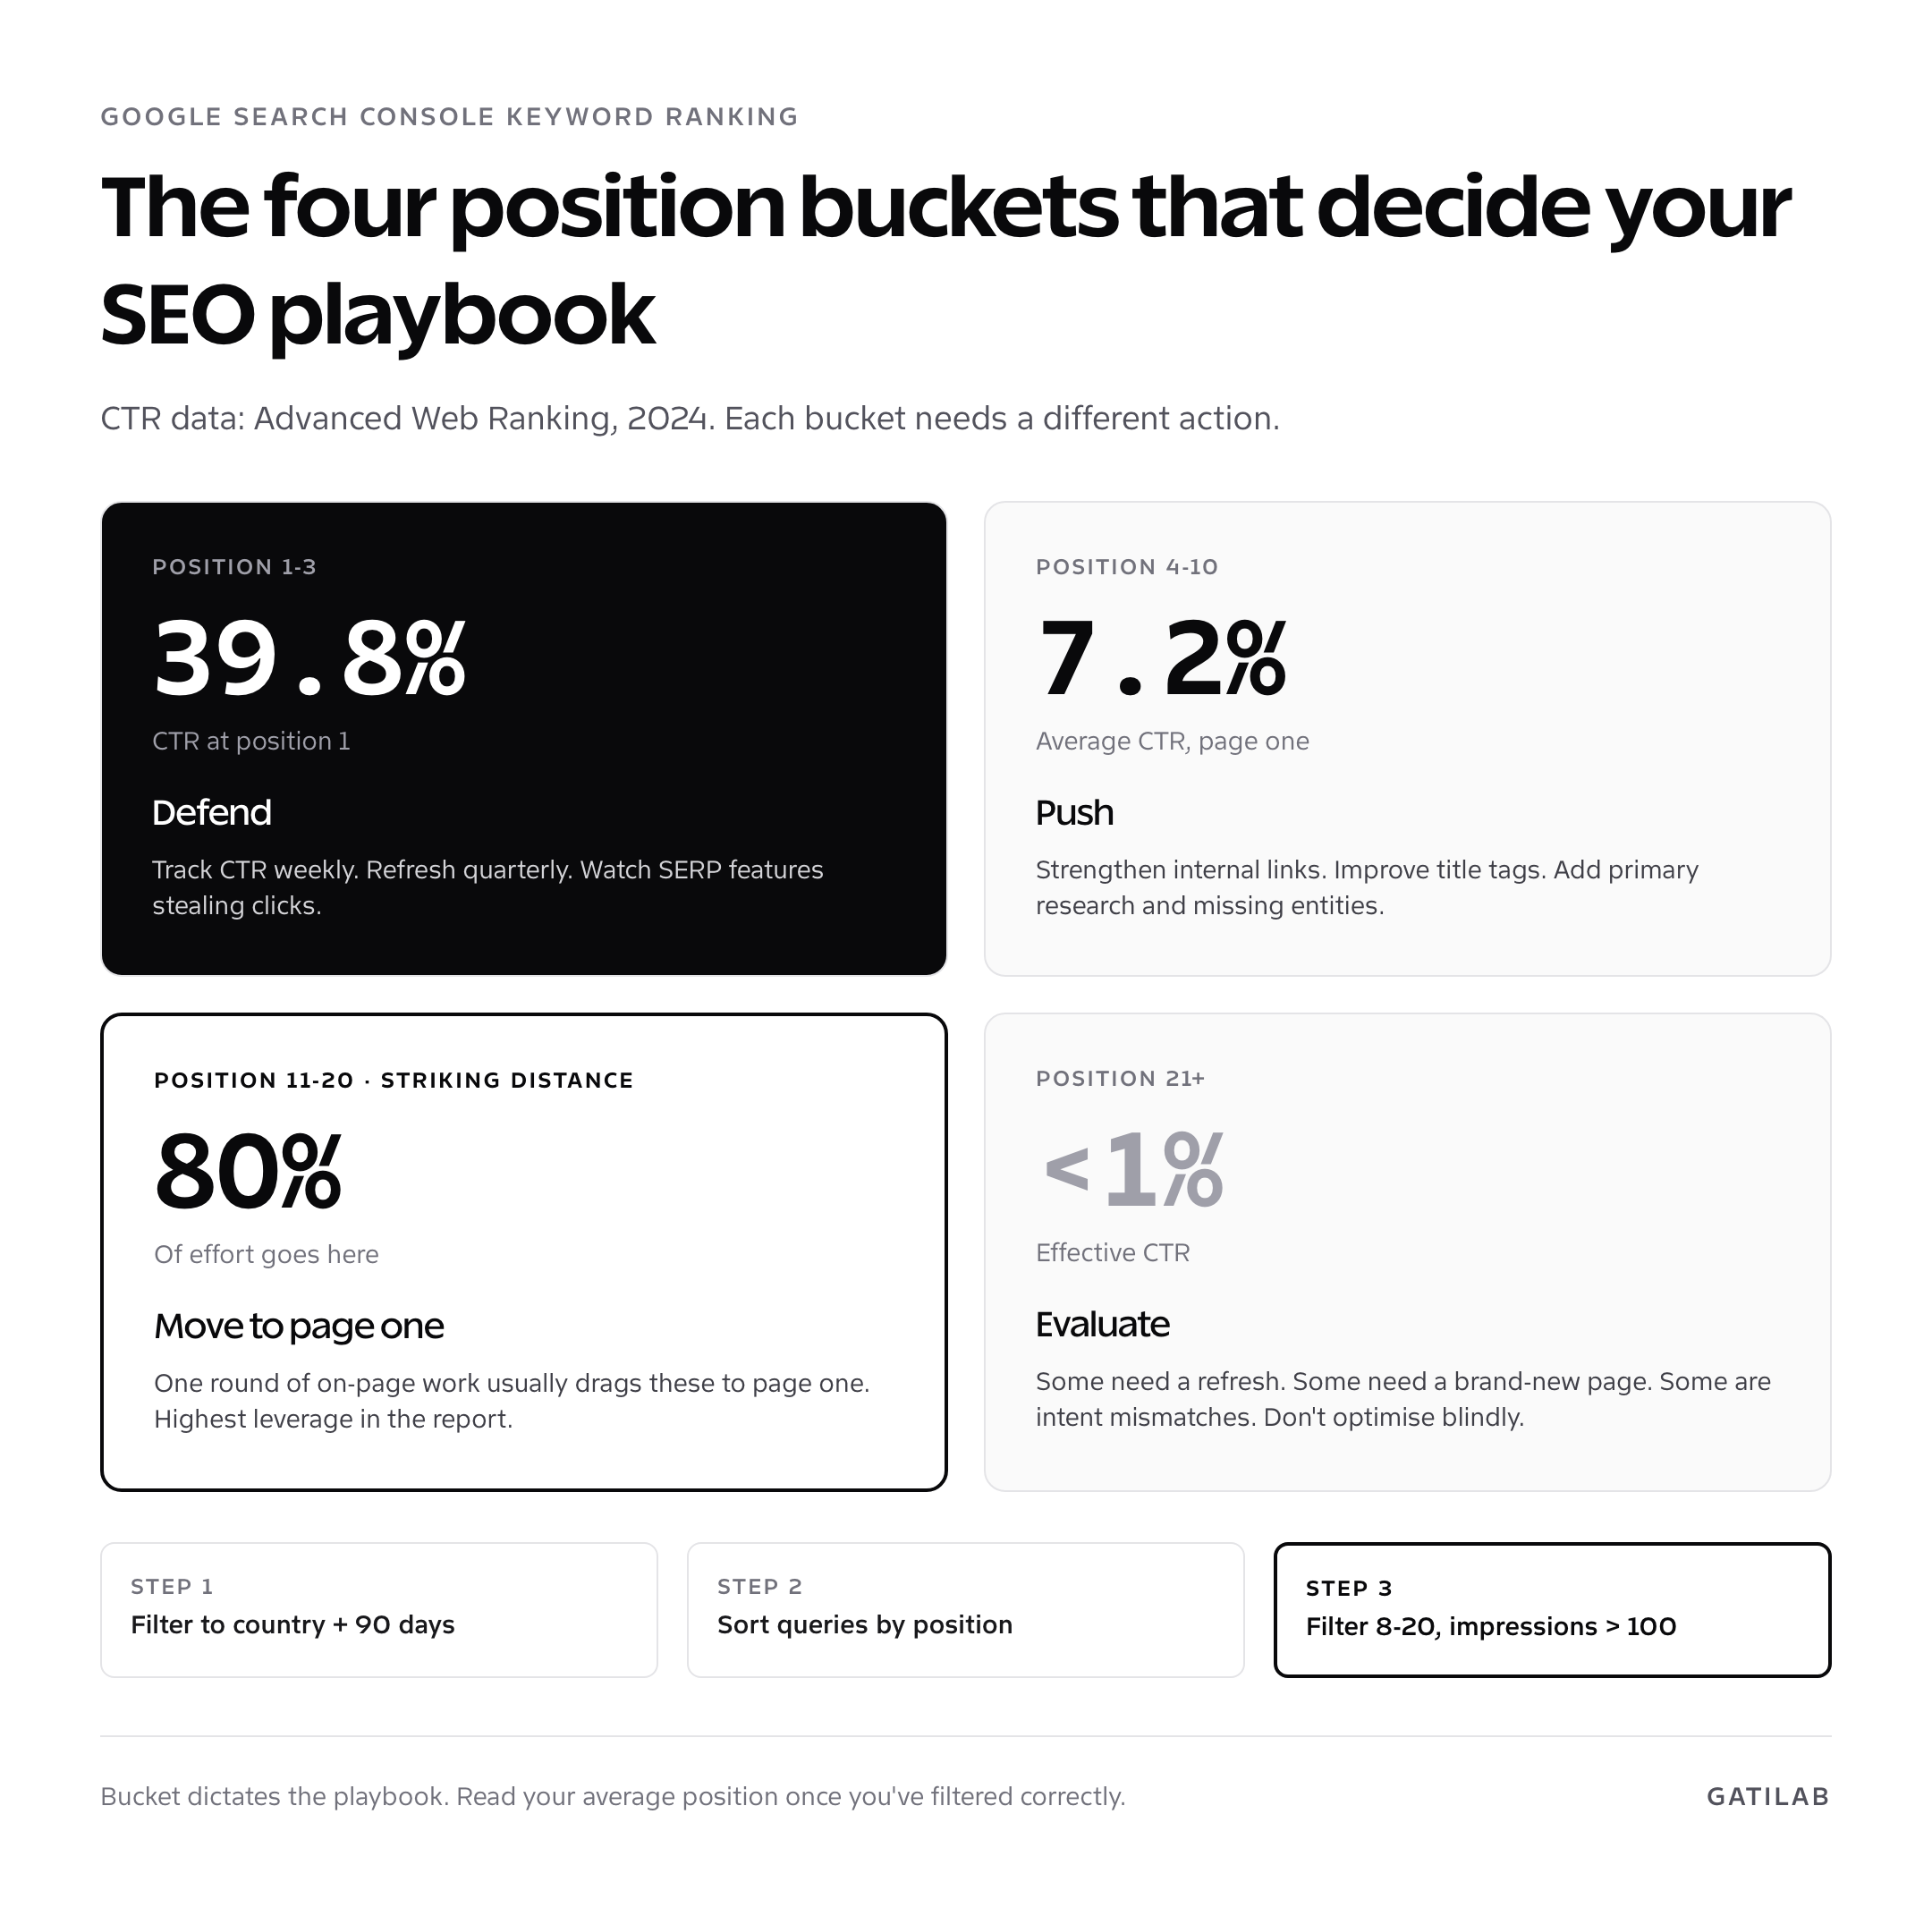
Treat your queries report as three separate buckets, because the same average position number means very different things in each. I rank queries by potential, not by current performance, and the bucket dictates the playbook.
- Position 1-3: defend. Track CTR, watch for SERP features stealing clicks, refresh content quarterly. Advanced Web Ranking’s 2024 study put position 1 CTR at 39.8% and position 3 at 10.2%, so each step up is real revenue.
- Position 4-10: push. These are page-one rankings that are leaving traffic on the table. Strengthen internal links, improve title tags, add primary research, fix the 1-2 entities the top three have that you don’t.
- Position 11-20: the striking-distance bucket. One round of solid on-page work usually drags these onto page one. This is where 80% of your effort should go in the first 90 days.
- Position 21+: evaluate before you invest. Some queries are rankable with a refresh. Others need a brand-new dedicated page or are simply mismatched intent. Don’t optimise blindly.
The five filters that turn average position into a real number
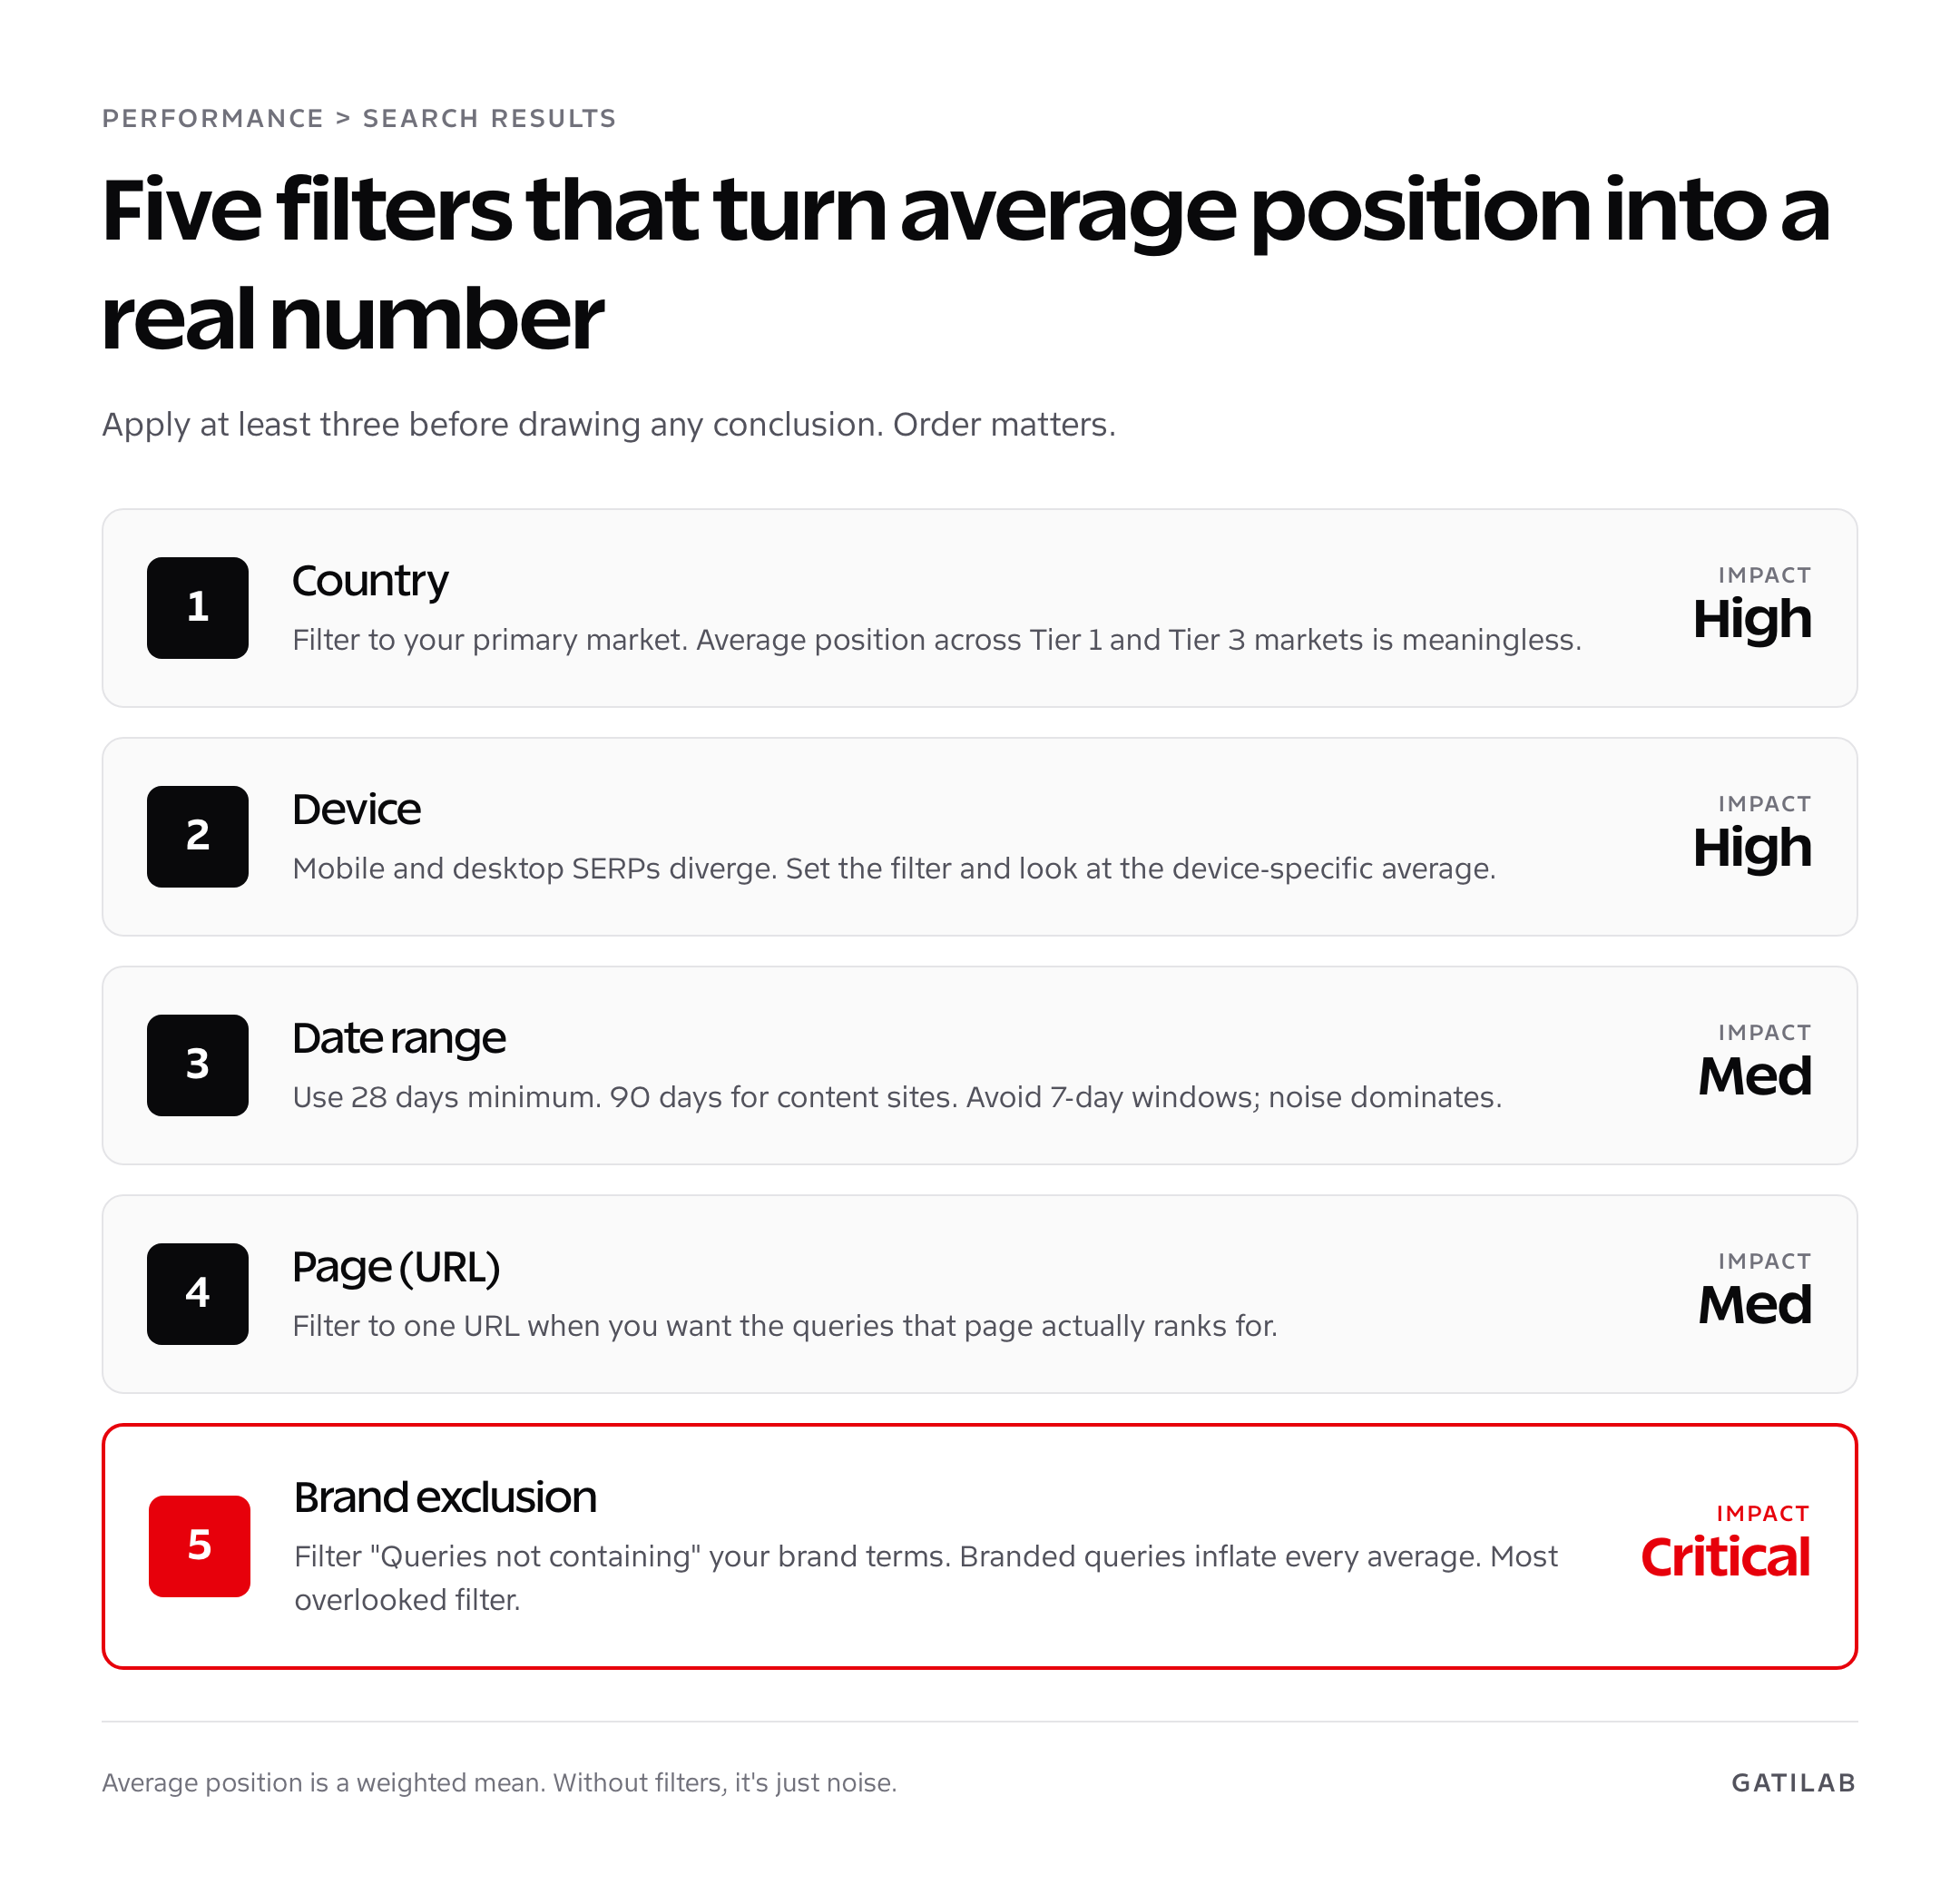
Filters are how you make the average mean something. Apply at least three before drawing a conclusion.
- Country. Add a country filter for your primary market. Average position across Tier 1 and Tier 3 markets is meaningless. Filter to United States, United Kingdom, Canada, Australia, or whatever your business actually serves.
- Device. Mobile and desktop SERPs diverge. If your audience is 70% mobile, set the filter and look at the mobile-only average.
- Date. Compare last 28 days to the previous 28 days, not last 7 days to last year. Short windows are noisy, long windows hide trends.
- Page. Filter to one URL when you want the queries that page actually ranks for. Otherwise the table mixes blog post and homepage queries.
- Query. Use “Queries containing” with brand terms removed to isolate non-branded performance. Branded queries inflate average position because you almost always rank #1 for them.
Building a striking-distance Google Search Console keyword ranking report
The single highest-leverage report you can build inside Search Console is the striking-distance report: queries ranking in positions 8 to 20 with at least 100 impressions. These are the queries Google already trusts you for. Pushing them up two or three slots produces immediate clicks without writing new content.
- Open Performance > Search results, set the date range to the last 3 months.
- Filter Country to your primary market, Search type to Web.
- Toggle Average position on, sort the Queries table by Position ascending.
- Export to Google Sheets or download CSV.
- In the sheet, filter Position between 8 and 20, Impressions over 100.
- Sort by Impressions descending. The top 30 rows are your priority list for the next sprint.
I run this exact report on every audit. On a content site I worked on in Q4 2024, the report surfaced 47 striking-distance queries; refreshing the 12 highest-impression URLs lifted total non-branded clicks by 31% in six weeks. The work was on-page only, no link building, no new pages.
BigQuery bulk export: the only way to see every keyword ranking
The 1,000-row UI cap is the single biggest blind spot in Search Console. The BigQuery bulk data export, generally available since February 2023, removes it entirely. Once configured, Google writes a daily dump of every impression, click, query, page, country, and device combination into a BigQuery dataset you control. There is no row limit and no anonymisation threshold for queries with at least one impression.
- Cost: storage runs roughly $0.02 per GB per month; query cost is the standard BigQuery pricing of $5 per TB scanned. A typical mid-size site stores under 5 GB per year.
- Latency: data lands in BigQuery 2 to 3 days after the activity date.
- Setup time: roughly 15 minutes if you already have a Google Cloud project; 45 if you don’t.
- Tables:
searchdata_site_impressionfor site-wide aggregates andsearchdata_url_impressionfor URL-level rows.
Once the data lands, you can write a single SQL query that returns every striking-distance keyword across the entire site, ranked by impression-weighted opportunity. I use this for any client over 500 indexed URLs, because the UI sampling silently kills 60-80% of mid-tail queries.
For deeper context on building a full audit around this data, see my website audit walkthrough, which uses Search Console as the foundation and layers in technical and on-page checks. If you are still picking tools to run alongside it, the SEO tools roundup covers the third-party rank trackers I run beside GSC for absolute-position data.
Why your Google Search Console keyword ranking differs from third-party trackers
Founders ask me this constantly. Search Console says position 11, Ahrefs says 7, Semrush says 9, and a manual incognito search shows 4. Every number is technically correct because every tool measures something different.
| Source | What it measures | Why the number differs |
|---|---|---|
| GSC Average Position | Impression-weighted average across all geos, devices, personalisation | Real-world average, not a controlled snapshot |
| Ahrefs / Semrush | Position from a single non-personalised desktop check, usually US | Unweighted snapshot; misses mobile, geo, SERP feature variance |
| Manual incognito | Live SERP for your IP, browser, and session | Personalised by location and recent searches |
| SERP API tools | Scraped SERP from a defined geo and device | Closer to GSC for that one slice, but only one slice |
I trust Search Console for trend direction and impression-weighted reality. I trust third-party trackers for daily change detection on a fixed list of money keywords. The two are complementary, never substitutes. For a structured ranking program, see my notes on SEO for startups, which lays out how to track only the 25 queries that drive revenue rather than the 5,000 that don’t.
How to track GSC ranking over time without losing your mind
Search Console retains 16 months of data, then rolls it off the back. If you want a longitudinal view, you have to export. I keep three workflows running in parallel for every site I manage.
- Looker Studio dashboard connected to the Search Console API, refreshing daily, with one chart per priority bucket: position 1-3, 4-10, 11-20, 21+. This is my live view.
- Monthly snapshot in Google Sheets capturing the top 100 queries by impressions, average position, clicks, and CTR. Twelve rows of history make ranking shifts impossible to miss.
- BigQuery long-term store where the bulk export accumulates without limit. When a client asks “what was our keyword position GSC reported in March 2023”, the answer is one query away.
The native Search Console UI was never designed for trend analysis past 16 months. Treat it as a query layer, not a system of record. The moment a site matters to revenue, the BigQuery export goes on, the Sheets snapshot goes on, and the dashboard is wired up. Without those three, you are flying blind on anything older than a year.
Pulling Google Search Console keyword ranking via the API
The Search Console API exposes the same data as the Performance UI, with the same 50,000-row daily cap on the searchAnalytics.query endpoint. It is the right tool when you want scheduled exports without paying for BigQuery, or when your reporting stack already runs on Python or Node.
- Endpoint:
POST https://www.googleapis.com/webmasters/v3/sites/{siteUrl}/searchAnalytics/query - Auth: OAuth 2.0 with the
webmasters.readonlyscope, or service-account access if you’ve added the service account as a property user. - Dimensions: any combination of
query,page,country,device,searchAppearance,date. - Row cap: 25,000 per request, paginated with
startRow. Max 50,000 rows per property per day across all calls.
For sites under the row cap, the API is the cheapest path to a full GSC position dataset. For larger sites, the BigQuery export wins on cost and completeness. I use both: API for daily snapshot reports, BigQuery for deep analysis.
Five Google Search Console keyword ranking anti-patterns
- Reading position without filtering country. A blended global average is meaningless if you sell in one market.
- Comparing 7-day windows. Daily noise dominates. Use 28 days minimum, 90 days for content sites.
- Treating average position as live rank. It is a backward-looking weighted mean, not a current SERP snapshot.
- Optimising the highest-impression query first. The biggest opportunities are usually mid-impression queries already in striking distance.
- Ignoring the position 11-20 bucket. Striking-distance queries are the cheapest wins available to any site.
A BigQuery SQL template for striking-distance ranking
Once your BigQuery export is running, the query below pulls every striking-distance opportunity in the last 90 days, scored by an impression-weighted opportunity index. I run a variant of this on every client at the start of an SEO sprint.
| SQL block | What it does |
|---|---|
SELECT query, url, AVG(sum_position/impressions) AS avg_pos, SUM(impressions) AS imps, SUM(clicks) AS clicks | Pulls the impression-weighted average position per query/URL pair. |
FROM searchdata_url_impression WHERE data_date BETWEEN DATE_SUB(CURRENT_DATE(), INTERVAL 90 DAY) AND CURRENT_DATE() | Limits the scan to the last 90 days. Saves money on the per-TB query cost. |
GROUP BY query, url HAVING avg_pos BETWEEN 8 AND 20 AND imps > 100 | Filters to striking-distance queries with meaningful impressions. |
ORDER BY imps DESC LIMIT 100 | Surfaces the top 100 opportunities, ranked by realised search demand. |
The cost of running this query on a 12-month dataset for a 5,000-URL site is typically under one cent. Schedule it weekly with BigQuery scheduled queries, write the result to a small reporting table, and connect Looker Studio. You now have an always-on opportunity dashboard that the Performance UI cannot produce.
Detecting ranking decay before the traffic drops
Position drops always precede click drops. By the time clicks fall, the ranking has been sliding for 10 to 20 days. The compare view in Search Console catches this if you set it up correctly.
- Open Performance, click Date, choose Compare last 28 days to previous period.
- Toggle Average position on, leave Clicks and Impressions on as well.
- Sort the Queries table by Position difference, descending.
- The top rows are queries that lost the most ground. Investigate the URL, look at the SERP, check whether a competitor refreshed.
- Cross-reference with the Pages tab to find URLs whose average position dropped more than 1.5 places in 28 days. That is your refresh queue.
Position decay almost always shows up before traffic decay. Watch the position diff column weekly. A page sliding from average 6 to average 9 will haemorrhage clicks within a month if you don’t intervene.
Case study: a 31% click lift from striking-distance work alone
In Q4 2024, I audited a B2B content site with roughly 240 indexed posts, 18,000 monthly clicks, and an average position of 14.7 for non-branded queries. The owner had been spending three days a month writing new content and zero days refreshing existing posts.
I exported 90 days of query-page data, filtered to position 8 to 20 with at least 100 impressions, and got 47 priority queries mapped to 12 unique URLs. We didn’t write a single new page. We added one primary-research statistic per URL, tightened the title tags, fixed three internal-link gaps, and inserted a short comparison table where competitors had one and we didn’t. Six weeks later the dashboard showed:
- Non-branded clicks: up 31% (from 13,400 to 17,560 monthly).
- Average position on the 47 target queries: 12.1 down to 6.8.
- Page-one queries (positions 1-10): up from 188 to 263.
- Total time invested: roughly 9 hours of writing across the 12 URLs.
The win wasn’t clever, it was sequencing. Search Console had been telling the owner exactly which queries were within reach for two years. He just hadn’t read the report.
Related Google Search Console workflows
Once you can read the position number reliably, the next two reports to master are the indexing pipeline and the URL-level diagnostic surface. My guide to the GSC URL Inspection tool walks through live tests, indexed status, and request-indexing limits. If a query you expect to rank for isn’t even logged, the issue is almost always indexing, and my walkthrough on fixing 404 errors in Search Console covers the most common reason a URL silently leaves the index. For broader CRO wins on the pages you do rank for, the CRO tools roundup covers the heatmap and form-analytics stack I pair with ranking data.
SERP features distort your ranking number more than you think
Average position counts the visual slot your URL occupies on the SERP, but Google treats every featured element as a position. Featured snippets, People Also Ask boxes, video carousels, image packs, and AI Overviews all consume a position slot before the first traditional blue link. If your page sits at “position 5” on a SERP with two organic results above the People Also Ask box, you are visually below the fold even though Search Console reports a top-half ranking.
To check ranking GSC reports against the actual SERP layout, open the Search Appearance tab in Performance. Filter to a single appearance type at a time, AI Overviews and Rich results are the two that matter most in 2026. The average position you see for “AI Overview” appearances is the position inside the AI Overview citation list, not the organic SERP, and the click-through behaviour is completely different.
One client of mine watched their average position improve from 8.2 to 5.4 over a quarter while clicks fell 12%. The diagnosis was simple once we filtered Search Appearance: their non-snippet positions had improved, but Google had launched AI Overviews on 38% of their target queries, and the AI box was eating clicks that previously went to position 5. The number told the truth, the visualisation hid it. Always cross-check the position number with what the SERP actually looks like for your top queries.
FAQ
What does Google Search Console keyword ranking actually measure?
It measures the impression-weighted average position your URL held for a query over the date range you selected, across every country, device, and personalisation slice. It is a backward-looking average, not a live rank.
Why is my GSC ranking different from Ahrefs or Semrush?
Third-party trackers run a single non-personalised desktop check from one country. GSC averages every real impression you received. The two methods almost never produce the same number, and both are correct for what they measure.
How often does GSC update keyword ranking data?
Performance data lags by 24 to 48 hours. The most recent two days in any chart are typically partial and will fill in over the next day.
What is a striking-distance keyword in Search Console?
A query ranking between positions 8 and 20 with enough impressions to matter, typically 100 or more in a 90-day window. These queries usually move to page one with a single round of on-page work.
Can I see every keyword my site ranks for in GSC?
Not in the UI, which caps at roughly 1,000 rows per query. The BigQuery bulk data export removes the cap and gives you every query with at least one impression, daily, with no anonymisation for non-rare queries.
Why does GSC show position 14 when I see position 4 in incognito?
Your incognito search is one personalised SERP from one location and device. GSC averages thousands of impressions across every geo and device combination. Filter to your country and primary device and the numbers will move closer.
How long should my date range be for keyword ranking analysis?
28 days for fast-moving content, 90 days for evergreen. Avoid 7-day windows for analysis, the noise drowns the signal. For year-over-year comparisons, use the last 16 months range.
Does Google Search Console show keyword search volume?
No. GSC only shows impressions, which are how often your URL was actually shown. Search volume is total queries from any source, ranked or not, and only third-party tools or Google Ads Keyword Planner expose that.
Tell Google you want more of this.
Add Gatilab as a preferred sourceOne tap, and this site shows up more often in your own Top Stories, AI Overviews and AI Mode. Remove it any time.