
TAM SAM SOM: Calculate a Defensible SaaS Market
TAM SAM SOM estimates become defensible only when each layer has a real constraint. Your SAM market isn’t every company that could theoretically use your software. It is the part of the total market your current product, geography, pricing, and delivery model can actually serve. Your SOM is smaller again: the revenue you can plausibly win with the channels and capacity you have.
Founders get into trouble when they start with a giant industry report and claim a tiny percentage. One percent sounds modest. It is still fiction if you can’t name the accounts, reach the buyers, support the product, or explain why they would switch.
- Market inputs: The SBA’s market-research checklist asks about demand, market size, location, saturation, pricing, and alternatives.
- Example limits: Account counts, a $2,400 annual contract value, reach, and conversion rates are teaching inputs, not a forecast for a real company.
- Recommendation: Build the market from eligible accounts and price, then use a top-down report only as a sense check.
What do TAM SAM SOM mean?
TAM is the entire eligible market, SAM is the part your current model can serve, and SOM is the part you can plausibly win within a defined period. Each smaller layer needs a named exclusion from the layer above.
| Term | Meaning | Practical question |
|---|---|---|
| TAM | Total addressable market | What would the category be worth if we served every relevant customer? |
| SAM | Serviceable available market | Which part can our current product and model serve? |
| SOM | Serviceable obtainable market | Which part can we realistically win in a defined period? |
The US Small Business Administration recommends testing demand, market size, location, saturation, pricing, and alternatives in its market-research guidance. I trust that checklist over an unsourced market-size slide because it forces you to connect the number to a real customer and buying environment.
What does TAM actually tell you?
TAM sets the outer boundary of the opportunity. It helps answer:
- Is the category large enough for the business you want to build?
- Does the product serve a narrow workflow or a broad platform need?
- Which assumptions create most of the market-size number?
- Is the business venture-scale, agency-scale, or a profitable niche product?
TAM does not tell you whether you can acquire customers profitably. A market can be large and still be terrible for you because buyers are fragmented, acquisition costs are high, or existing workflows are difficult to replace.
How do you calculate a SAM market?
SAM applies current constraints to TAM.
Remove customers you can’t serve because of:
- Geography
- Language
- Regulation
- Required integrations
- Company size
- Buying process
- Product capability
- Support model
- Pricing
- Security or compliance requirements
If your SaaS only supports English, sells through self-service, and integrates with Shopify, you can’t count every retailer on earth. The exclusion isn’t pessimism. It is the difference between a market and a wish.
How do you calculate SOM?
SOM includes the limits founders prefer to ignore:
- How many accounts can your channels reach?
- How many fit the target profile?
- How many enter a buying process?
- How many can sales close?
- How many can onboarding support?
- How many will remain customers?
- Over what period?
This is where market sizing meets your SaaS marketing strategy. A market may be serviceable but not obtainable through your current channels.
Is top-down or bottom-up market sizing better?
Both approaches can help, but they answer the question from opposite directions.
Top-down
Top-down sizing starts with a research report, industry revenue, or broad population and filters down.
Example:
- Global software category: $10 billion
- Small-business share: 20%
- Target-region share: 10%
- Claimed market: $200 million
The arithmetic is easy. The assumptions may have little connection to your product.
Use top-down estimates as a sense check, not your only model.
Bottom-up
Bottom-up sizing starts with real potential customers and the price they could pay.
Formula:
number of eligible accounts × annual revenue per account = annual market value
This method forces you to define the account, product, and price. It is usually more defensible for SaaS.
What does a worked SaaS market-size example look like?
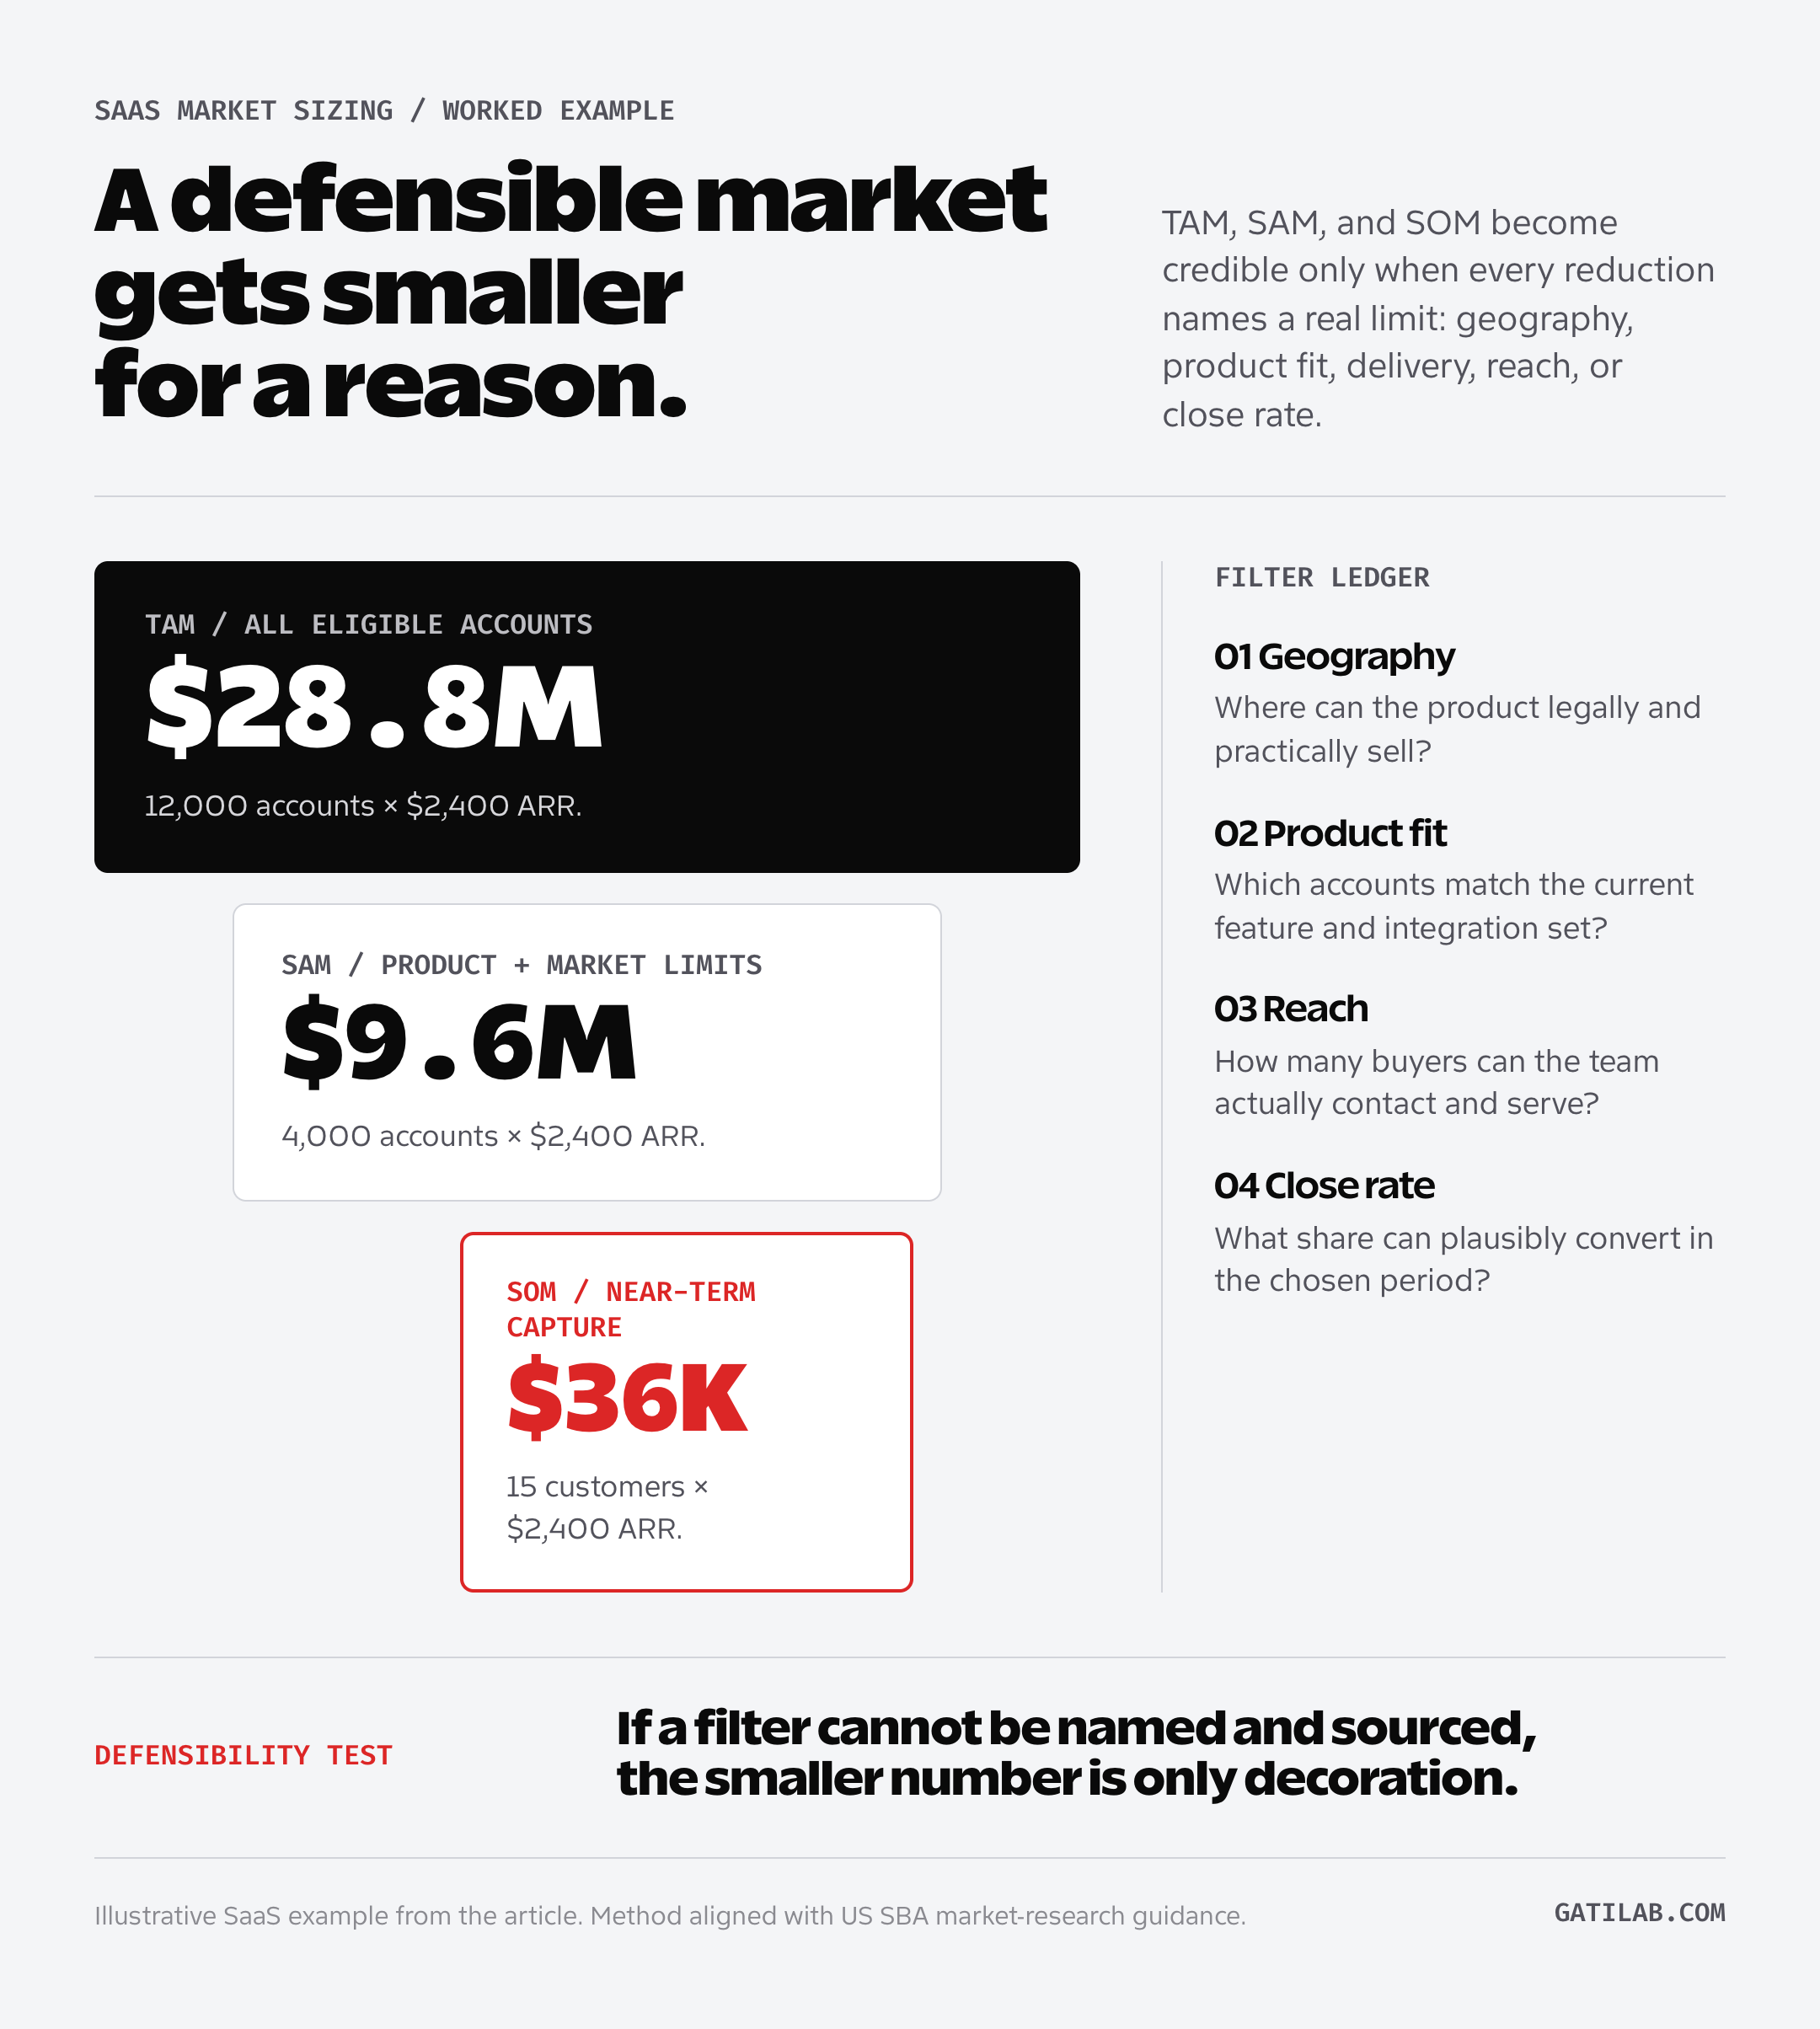
Suppose you sell approval software to small creative agencies. Every number in this example is an assumption chosen to expose the calculation.
Step 1: define the unit
The customer is an agency with:
- 10 to 75 employees
- At least five active client projects
- A recurring approval workflow
- A supported accounting and storage stack
- An English-speaking operations team
Your average subscription is $200 per month, or $2,400 in annual recurring revenue.
Step 2: calculate TAM
You identify 12,000 agencies worldwide that match the broad customer definition.
12,000 accounts × $2,400 ARR = $28.8 million TAM
Step 3: calculate SAM
Your product currently supports only three countries, one language, and two required integrations. After applying those filters, 4,000 accounts remain.
4,000 accounts × $2,400 ARR = $9.6 million SAM
Step 4: calculate SOM
Your content, partnerships, and outbound capacity can reach 600 qualified accounts over three years. You assume:
- 20% enter a meaningful sales conversation
- 25% of those start a trial or pilot
- 50% of pilots become customers
600 × 20% × 25% × 50% = 15 customers
15 customers × $2,400 ARR = $36,000 obtainable ARR
That number may feel small next to the TAM. Good. It exposes the current channel and conversion constraints.
Now you can improve the model by expanding integrations, increasing reach, changing price, or improving conversion. You have a business problem to solve, not a slide to decorate.
Which TAM, SAM, and SOM formulas belong in a spreadsheet?
Use bottom-up formulas with explicit account counts, annual revenue per account, serviceability filters, reach, and conversion rates. That makes every result traceable to an assumption you can challenge.
| Metric | Formula | Example |
|---|---|---|
| TAM accounts | All eligible accounts | 12,000 |
| TAM revenue | TAM accounts × annual revenue/account | $28.8M |
| SAM accounts | TAM accounts × serviceable percentage | 4,000 |
| SAM revenue | SAM accounts × annual revenue/account | $9.6M |
| Reachable accounts | Qualified accounts your channels can reach | 600 |
| Opportunities | Reachable accounts × opportunity rate | 120 |
| Pilots | Opportunities × pilot rate | 30 |
| Customers | Pilots × close rate | 15 |
| SOM revenue | Customers × annual revenue/account | $36,000 |
Do not use one price if the product has materially different customer segments. Calculate each segment separately and add the results.
Your SaaS pricing model changes market size too. Per-seat, usage-based, and flat-rate models produce different revenue per account and different exclusion rules.
Which market-sizing mistakes inflate the answer?
Most inflated numbers come from one of these shortcuts.
Counting users instead of buyers
Millions of people may experience the problem. A much smaller number control a budget and can purchase the product.
Using search volume as market size
Search demand can reveal interest. It doesn’t equal customers, contracts, or annual revenue.
Ignoring current product limits
A roadmap item isn’t a current capability. Keep future SAM in a separate scenario.
Treating every company as equally valuable
Segment by company size, usage, or willingness to pay. One enterprise contract and one solo-user subscription aren’t interchangeable.
Applying arbitrary percentages
“If we win 1%” avoids the work of explaining acquisition, conversion, onboarding, and retention.
Forgetting churn
SOM revenue is not durable if customers leave quickly. Connect the model to MRR, ARR, churn, LTV, and CAC.
How should market size change a business decision?
A market-size model should change at least one decision.
Product
A large excluded segment may justify an integration, language, or compliance investment. A small segment may not.
Channel
If buyers are concentrated in 200 named accounts, broad content may support trust but won’t replace account-based sales.
Pricing
If the reachable market is small, low pricing may make the business structurally weak. If the value is high, packaging and proof need to support a higher price.
Hiring
Don’t hire a large sales team for a market you can only reach through founder relationships and a few specialist partners.
Positioning
A tighter minimum viable audience can make the first market smaller and the message much stronger.
How do you build conservative, base, and aggressive scenarios?
Use conservative, base, and aggressive versions.
Change only assumptions you can name:
- Eligible accounts
- Average annual revenue
- Reach
- Opportunity rate
- Trial or pilot rate
- Close rate
- Retention
- Time period
Show the source and date for every major input. If an input comes from judgment, label it as an assumption.
FAQs
Keep the units, filters, and time frame consistent when you use these definitions.
What is the difference between SAM and SOM?
SAM is the market your current product and business model can serve. SOM is the portion you can realistically acquire through your channels, conversion rates, capacity, and time frame.
Should TAM be based on revenue or users?
Use the unit that matches the business model. For SaaS, eligible accounts multiplied by annual revenue per account is usually more useful than a raw user count.
Is top-down market sizing wrong?
No. It is useful as an external sense check. Bottom-up sizing is usually more defensible because it connects the market to real accounts, pricing, and product eligibility.
How often should TAM, SAM, and SOM change?
Revisit the model when pricing, target customers, geography, product capability, or channel reach changes. SOM should also change as you collect real conversion and retention data.
Can SOM be larger than SAM?
No. SOM is a subset of SAM, and SAM is a subset of TAM. If the numbers violate that order, the definitions or units are inconsistent.
Tell Google you want more of this.
Add Gatilab as a preferred sourceOne tap, and this site shows up more often in your own Top Stories, AI Overviews and AI Mode. Remove it any time.