
SaaS Churn Rate: 2026 Benchmarks, Formulas, and How to Reduce It
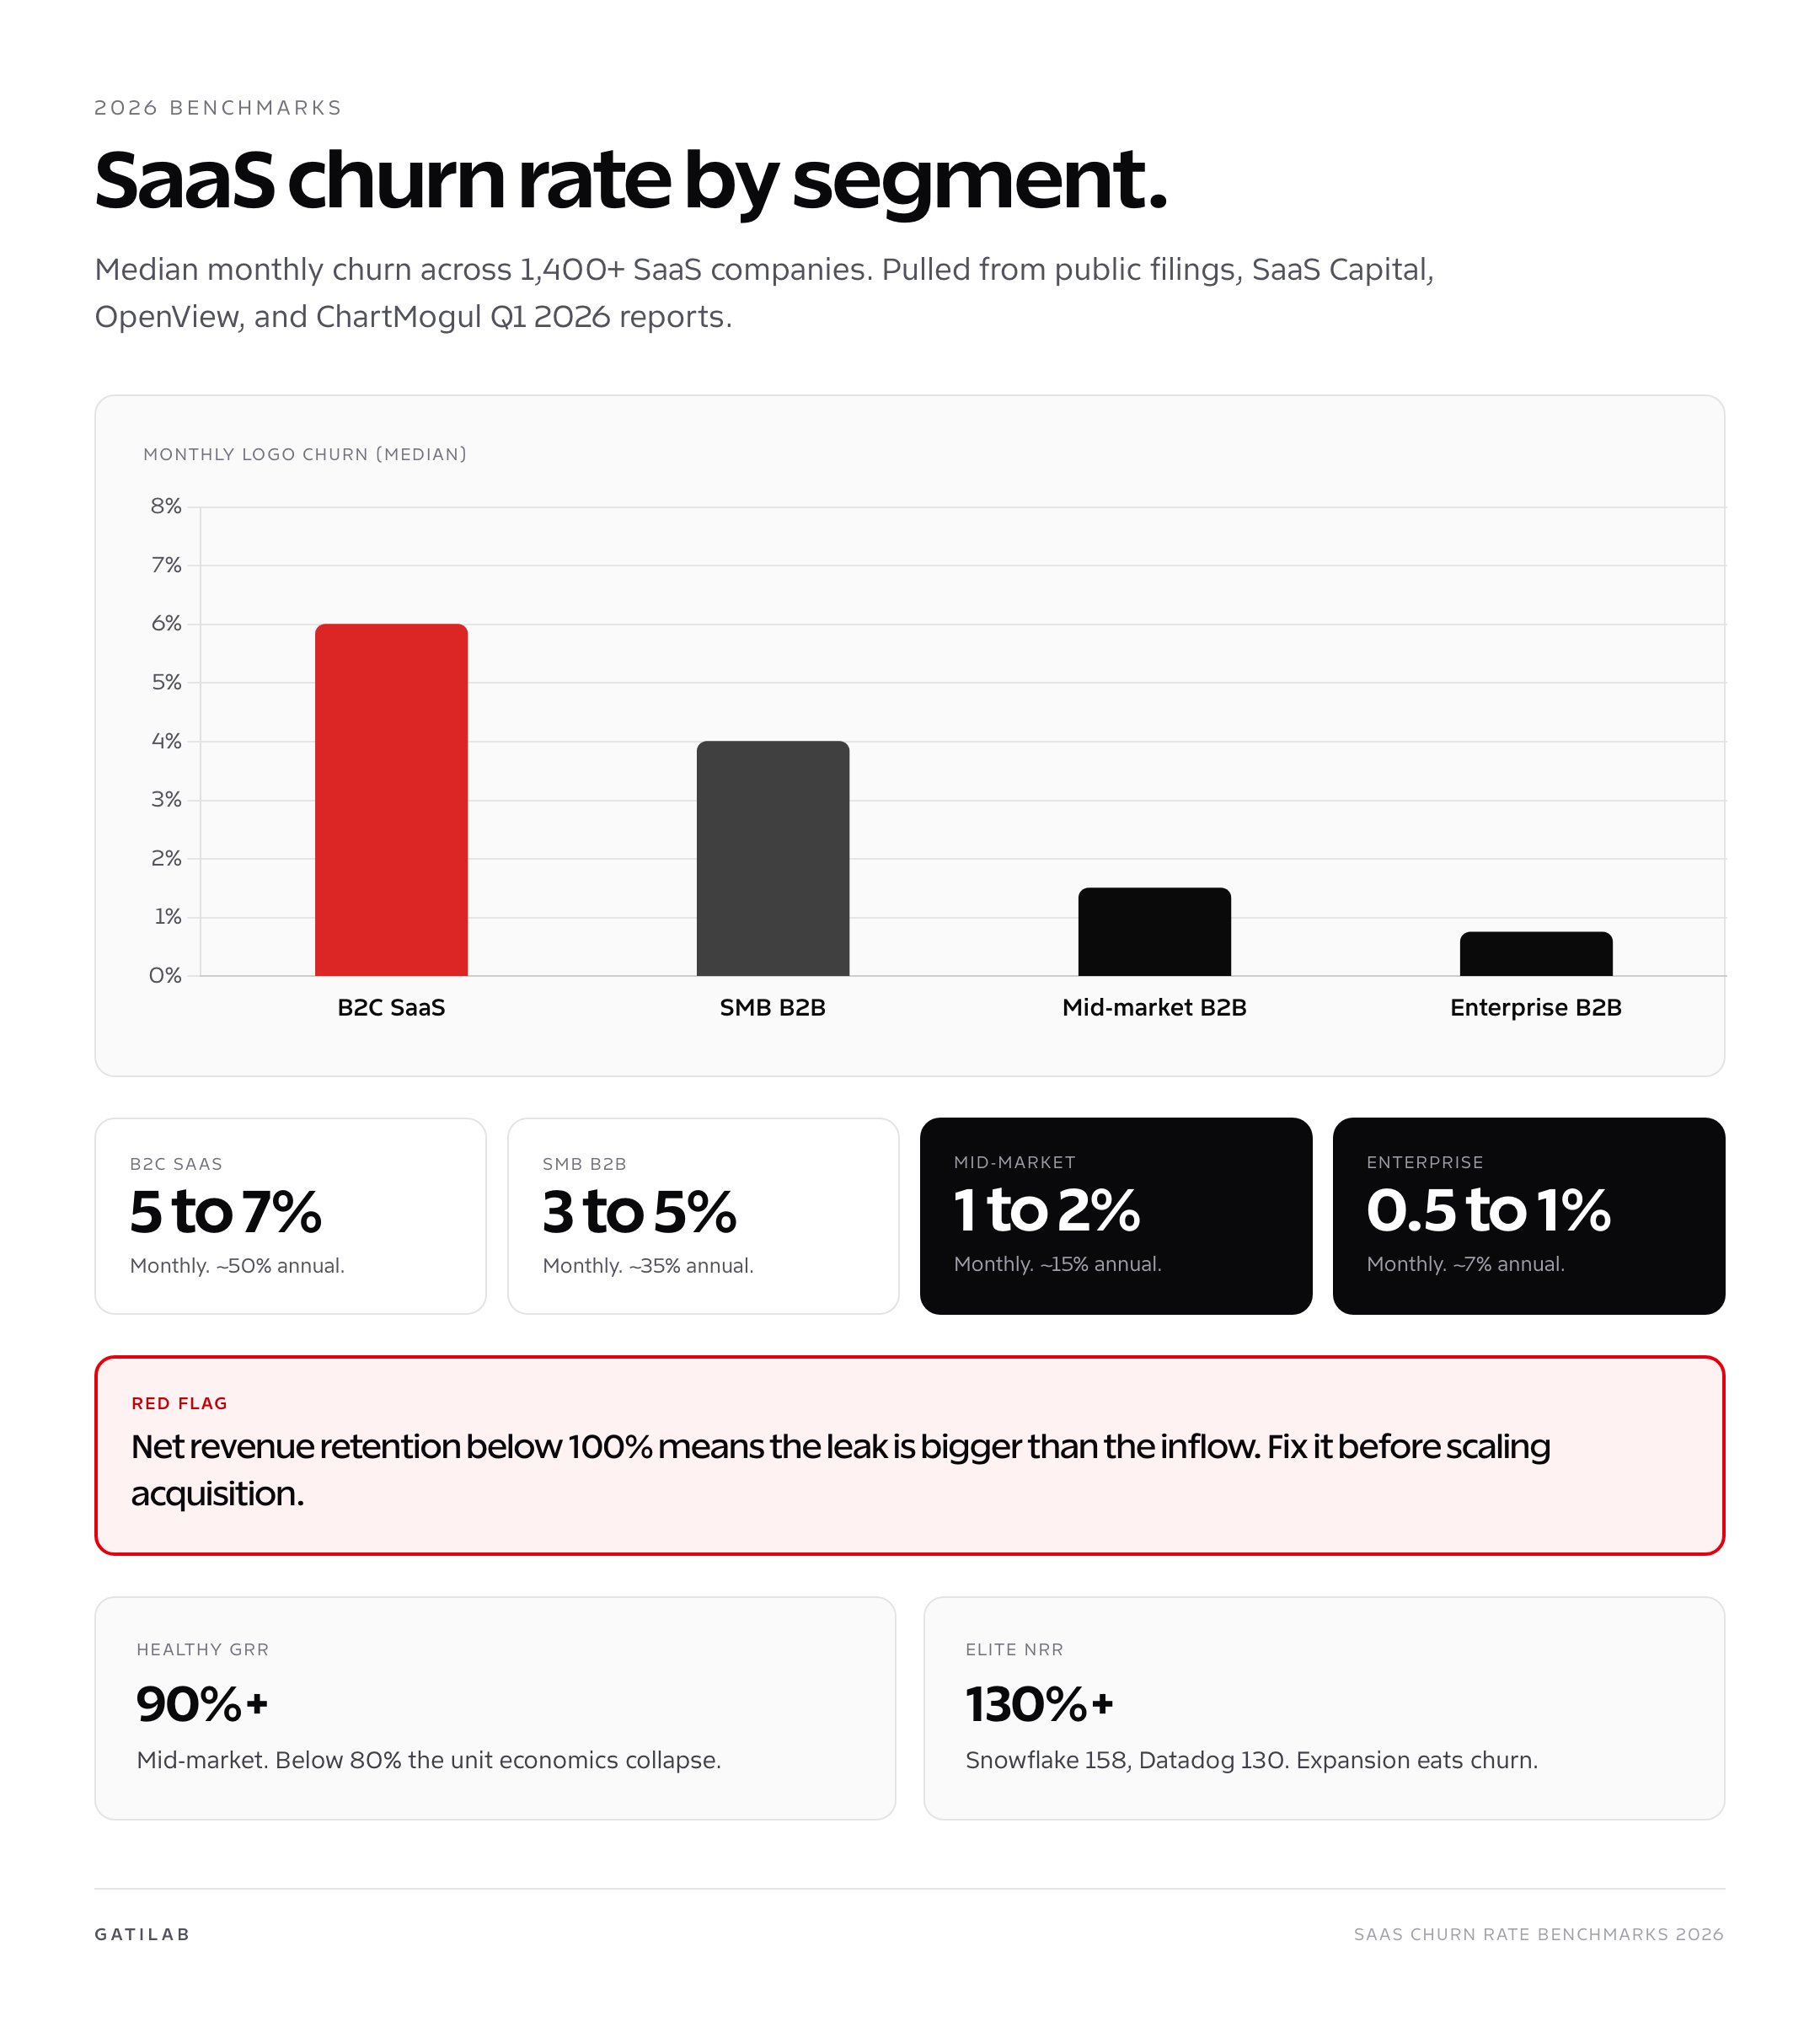
SaaS churn rate is the metric that decides whether your business compounds or leaks. Two companies with identical acquisition can land in completely different places three years later because one runs 4% monthly churn and the other runs 1.5%. The difference compounds. Most founders underestimate how much.
SaaS churn changes how much recurring revenue must be replaced before a company can grow. This guide defines the formulas, separates logo churn from revenue retention, and uses current private-company cohorts without presenting one universal target for every SaaS model.
What SaaS Churn Rate Actually Measures
SaaS churn rate is the percentage of customers (or revenue) you lose in a given period, usually a month or a year. It’s the single most important retention metric in subscription businesses, and it’s the input that drives nearly every other metric you care about: LTV, CAC payback, cash burn, ARR forecast, and valuation multiples in any kind of liquidity event.
The reason churn matters more than acquisition is compounding. At 5% monthly churn, you lose 46% of customers in a year. At 2% monthly, you lose 22%. At 1% monthly, you lose 11%. The arithmetic difference between 5% and 2% is 3 percentage points; the compound difference is 24 percentage points of annual retention. That gap turns into the difference between a 5x LTV/CAC ratio and a business that can’t pay back acquisition at all.
SaaS Capital’s 2025 benchmark survey of 1,400+ B2B SaaS companies pegged median annual gross logo churn at 14%, with the top quartile at 5% and the bottom quartile at 26%. The spread between top and bottom quartile is 5x, which is enormous, and most of the variance comes from segment, contract length, and ICP fit rather than from product quality alone.
Logo Churn vs Revenue Churn
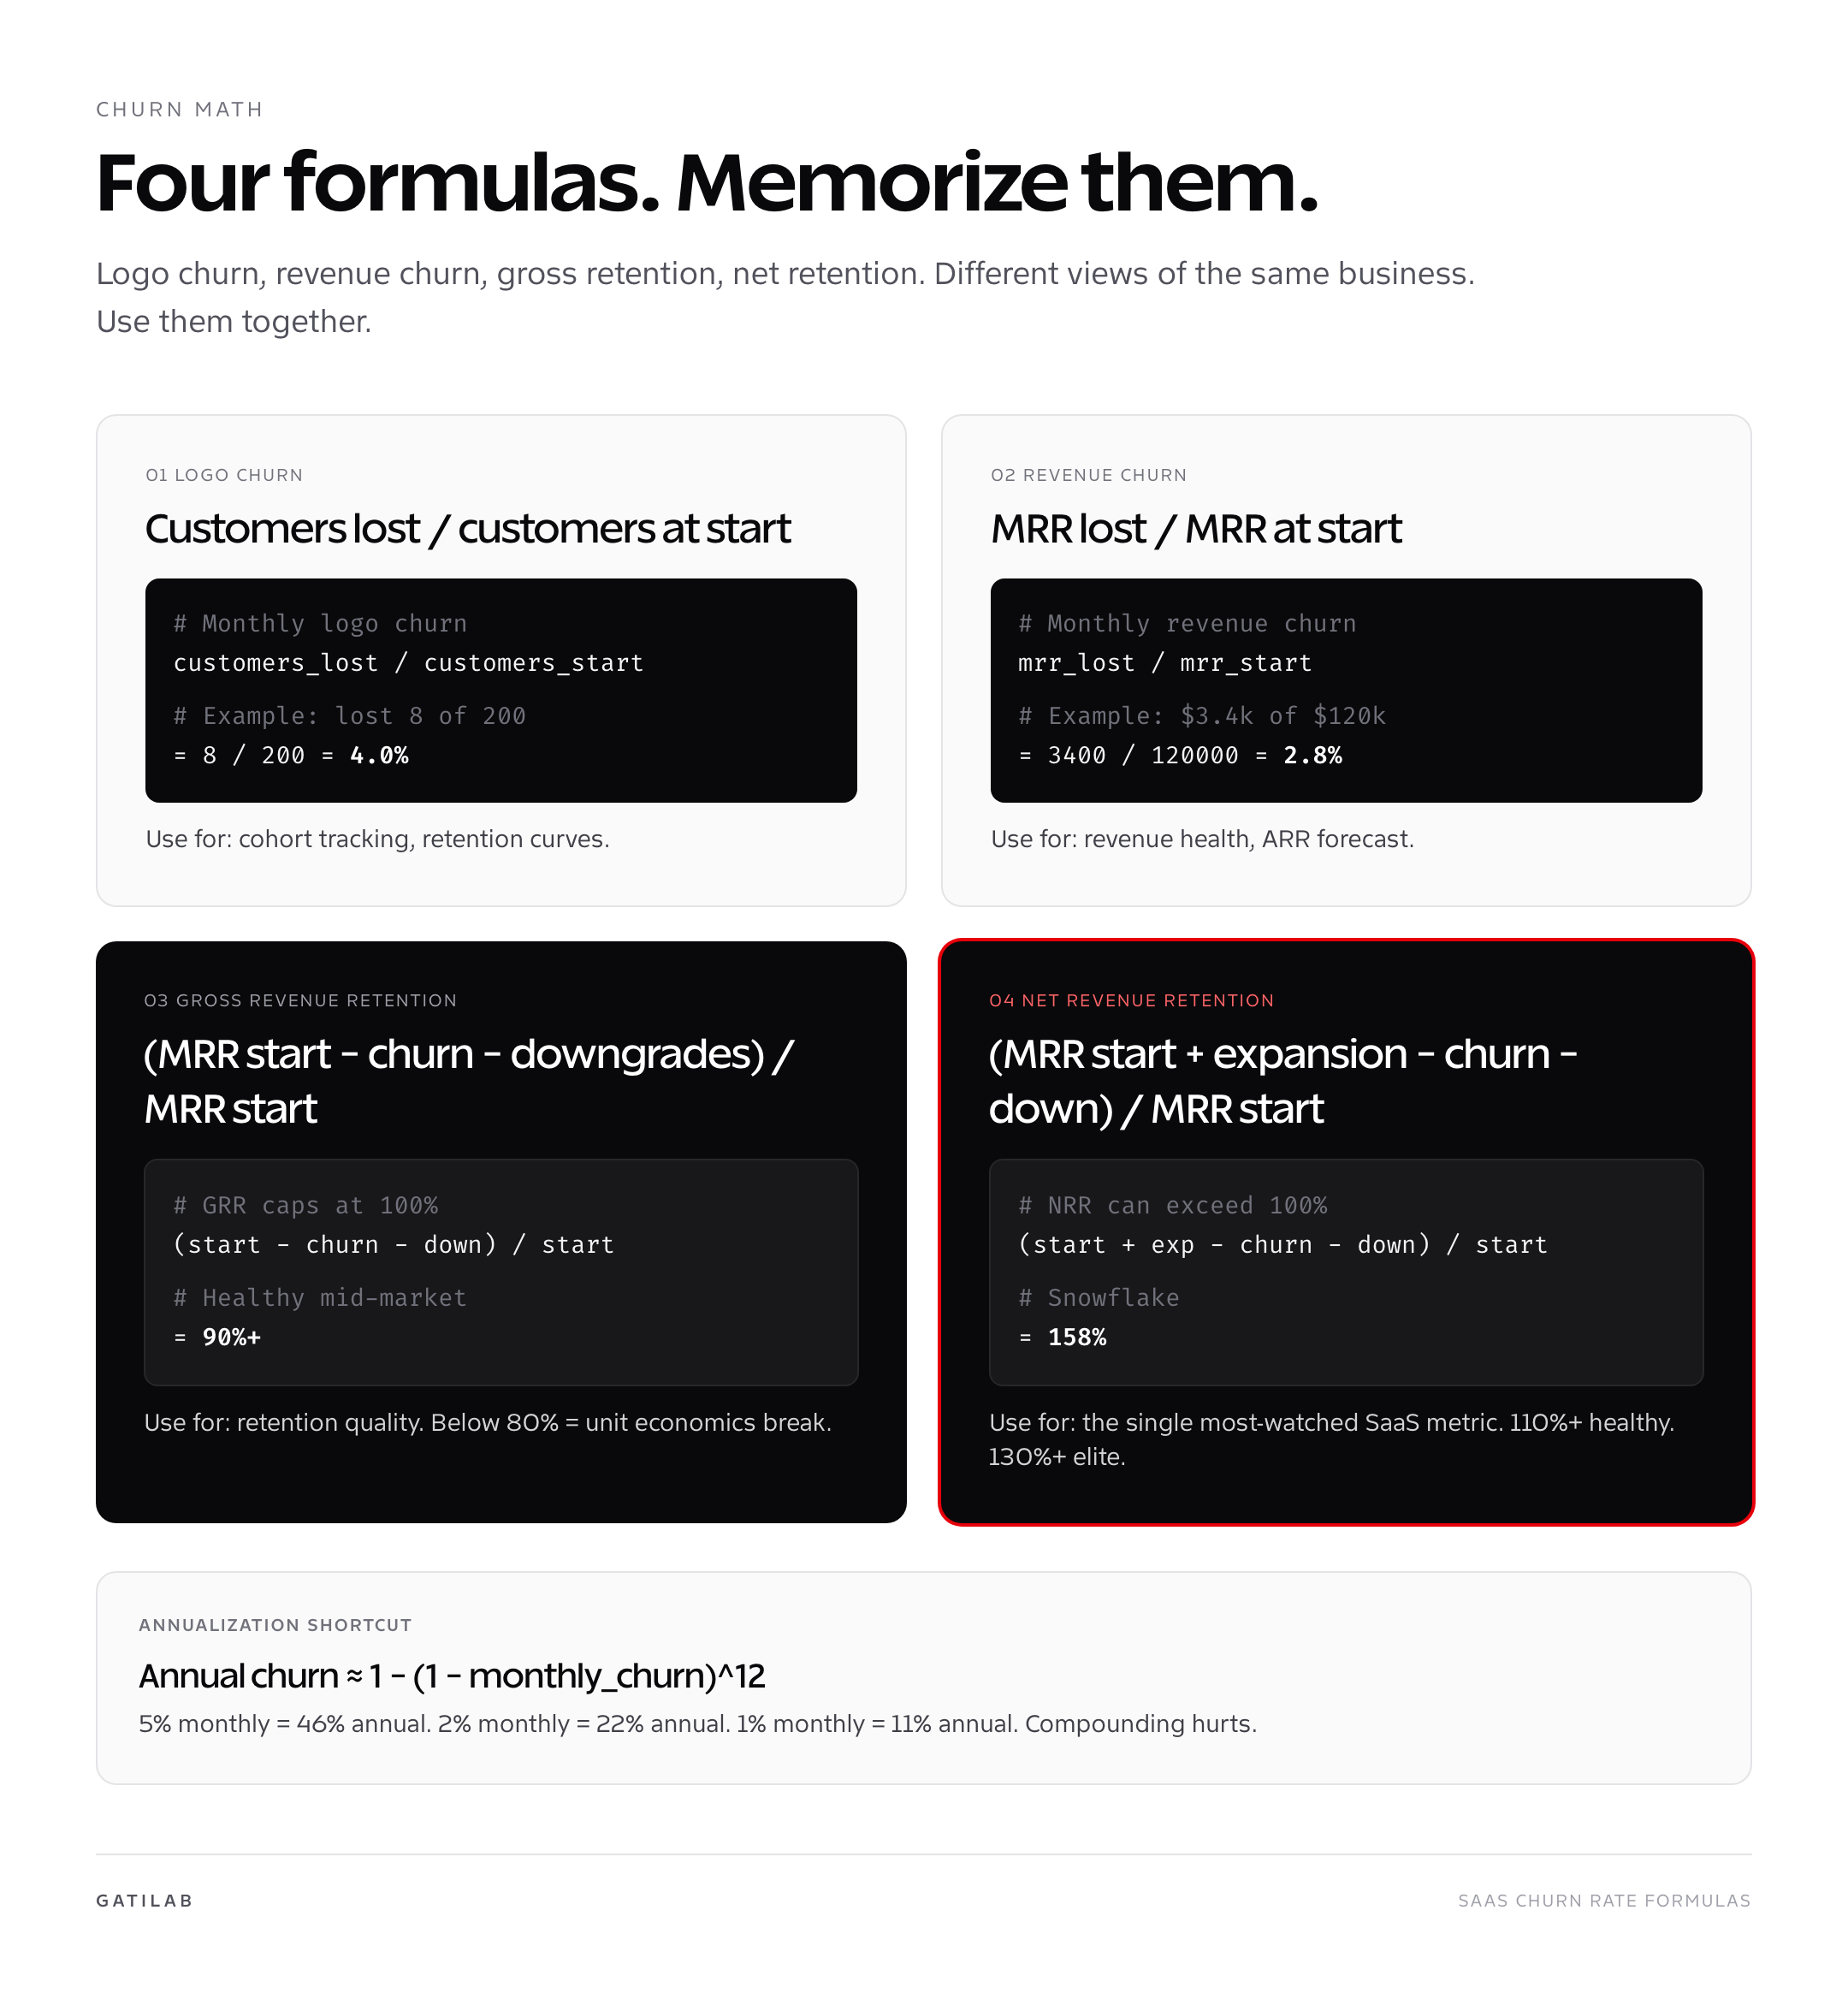
Two SaaS churn rate views, two different stories. Logo churn measures customer count: how many customers cancelled. Revenue churn measures dollars: how much MRR walked out the door. They diverge whenever your customer base has a price spread, which it almost always does.
| Metric | Formula | Best for | Common range |
|---|---|---|---|
| Monthly logo churn | customers lost / customers at start | Cohort retention, product health | 1 to 7% monthly |
| Monthly revenue churn | MRR lost / MRR at start | Revenue forecast, ARR planning | 0.5 to 5% monthly |
| Annual gross logo churn | 1 − (1 − monthly logo churn)^12 | Industry benchmarking | 10 to 50% annual |
| Annual gross revenue churn | 1 − (1 − monthly revenue churn)^12 | VC reporting, board reviews | 5 to 35% annual |
Revenue churn typically runs lower than logo churn because the customers who cancel skew toward smaller plans. A B2B SaaS with $80 average revenue per account that loses three $80 customers and one $800 customer has logo churn of 4 customers but revenue churn dominated by the $800 loss. Track both and watch the gap. A widening gap between logo churn (rising) and revenue churn (stable) means you’re losing small customers and keeping big ones, which is healthy. A widening gap the other way is a fire.
Gross Retention vs Net Retention
Gross revenue retention measures starting recurring revenue retained after churn and contraction, before expansion. Net revenue retention includes expansion from that same starting cohort.
| Metric | Formula boundary | Synthetic example |
|---|---|---|
| GRR | (Starting recurring revenue – contraction – churn) / starting recurring revenue | ($1,000,000 – $30,000 – $70,000) / $1,000,000 = 90% |
| NRR | (Starting recurring revenue + expansion – contraction – churn) / starting recurring revenue | ($1,000,000 + $150,000 – $30,000 – $70,000) / $1,000,000 = 105% |
GRR cannot exceed 100%. NRR can exceed 100% because expansion is included. Read both beside the current benchmark cohort rather than applying an unsupported ‘healthy’ threshold.
For the broader mechanics, see SaaS metrics explained: MRR, ARR, churn, LTV, and CAC.
SaaS Churn Benchmarks for 2026
The most useful current private-company benchmark is a defined cohort, not a universal monthly churn target. SaaS Capital surveyed more than 1,000 private B2B SaaS companies and published a separate view for bootstrapped companies with $3 million to $20 million in ARR.
| Metric | Median | 90th percentile | Cohort |
|---|---|---|---|
| Revenue growth | 15% | 42.3% | Bootstrapped B2B SaaS, $3M-$20M ARR |
| Net revenue retention | 103% | 117.9% | Same cohort |
| Gross revenue retention | 91% | 100% | Same cohort |
A 91% annual GRR means 9% of starting recurring revenue was lost before expansion. It does not mean 9% monthly logo churn. If that annual loss were spread evenly, it would be roughly 0.78% per month on a compounded revenue basis. Source and methodology
How to Calculate SaaS Churn Rate Without Lying to Yourself
Most churn calculations are subtly wrong. The mistakes are easy to make and hard to spot in a spreadsheet, and they always flatter the number. Five rules I follow when I run the math.
- Use a fixed cohort denominator. Customers at the start of the period, not the average over the period. Averaging hides churn during high-acquisition months.
- Exclude trial cancellations. A trial that doesn’t convert isn’t churn; it’s a failed acquisition. Mixing the two flatters retention.
- Separate voluntary and involuntary churn. Failed credit cards (involuntary) are recoverable through dunning. Cancellations (voluntary) need product or success interventions. Different problem, different fix.
- Annualize correctly. Annual churn = 1 − (1 − monthly churn)^12. Don’t multiply monthly by 12; that overstates churn for low monthly rates and understates for high.
- Report MRR-based churn for revenue planning. Logo churn is for product health. Revenue churn is for finance. Confuse them and your forecast will be off by 30%.
Why SaaS Customers Churn
A cancellation reason is a reported label, not always the root cause. Segment churn by acquisition source, plan, contract, customer age, activation, usage, support history, payment status, and cancellation reason.
- Wrong-fit acquisition appears as low activation and early voluntary churn.
- Failed payments and expired cards create involuntary churn.
- Low product usage can reflect poor onboarding, weak value, missing capability, or a seasonal job.
- Price objections need margin, usage, and value context before becoming a discount decision.
- Customer shutdowns and mergers are different from competitive losses.
Map each mechanism to a specific intervention.
How to Reduce SaaS Churn Rate
The highest-leverage churn reduction work is preventive, not reactive. By the time a customer hits cancel, you’ve already lost them; the playbook above is about making sure they don’t get there.
- Tighten your ICP at acquisition. Half of churn is wrong-fit customers signing up. Wrong-fit means they buy, never activate, and cancel inside 90 days. Reject them on the marketing side, not after they’ve paid.
- Engineer activation into onboarding. The first session is where lifelong retention is decided. Strip friction. Get the user to value in under 15 minutes. See the complete guide to SaaS customer success for in-product success patterns.
- Catch involuntary churn with dunning. Failed credit cards account for 20 to 40% of monthly churn in B2C and SMB. Tools like Stripe Radar, Recharge, or Churnkey recover 30 to 60% of failed payments. Lowest-effort, highest-ROI churn work in SaaS.
- Run a usage-based health score. Customers stop using before they cancel. A health score that flags accounts with declining usage gives you a window to intervene 30 to 60 days before cancellation, when intervention still works.
- Move to annual billing for the right customers. Annual contracts cut churn 30 to 50% by removing the monthly cancel decision. Discount 15 to 20% to make the trade obvious; it’s cheaper than the equivalent churn loss.
- Build expansion into the pricing. Per-seat or usage-based pricing means existing customers grow revenue automatically. NRR above 110% offsets churn entirely, which is why expansion-friendly pricing is the highest-leverage churn defense long-term.
- Segment your churn analysis. Aggregate churn hides the truth. Cohort by acquisition source, by plan size, by industry. The high-churn cohorts almost always have a structural reason you can fix once.
The compounding payoff is enormous. A 1-point monthly churn reduction (from 4% to 3%) at $1M ARR adds roughly $200k to ARR over 24 months, with no additional acquisition spend. That’s the math founders miss when they over-invest in top-of-funnel and under-invest in retention.
How to Read Retention Disclosures
Public companies do not all disclose the same retention metric. Some report NRR, some dollar-based net retention, some GRR, and some only customer counts. The threshold, customer cohort, currency treatment, acquisitions, and reporting period can differ.
- Use the exact metric name from the filing.
- Record whether the rate is monthly, quarterly, annual, or trailing 12 months.
- Keep enterprise and self-serve cohorts separate when the company does.
- Do not compare a customer-count retention rate with revenue retention.
How to Track SaaS Churn
The billing system supplies invoices, subscriptions, discounts, and payment status. Product analytics supplies activation and usage. The CRM and support system supply segment and relationship context. Join them on a stable customer identifier.
A tool is useful only if its metric definition matches the company’s reporting boundary. Define MRR, customer, reactivation, pause, contraction, expansion, and cancellation before buying a dashboard.
Connect retention to how to create a SaaS marketing strategy so acquisition quality and churn are evaluated as one system.
SaaS Churn and Valuation
Retention affects the durability and replacement cost of recurring revenue, but it does not determine a valuation multiple by itself. Growth, margin, market, concentration, contract terms, cash flow, and capital conditions also matter.
Do not publish a valuation multiple from a benchmark roundup without the public-company sample, measurement date, metric definition, and calculation method.
When SaaS Churn Rate Lies to You
Even with clean formulas, the SaaS churn rate number can mislead. Five situations where the headline metric tells the wrong story and what to look at instead.
Rapid growth masking churn. When new MRR is growing 30% month-over-month, churn becomes a smaller fraction of total MRR even if the absolute number of cancellations is climbing. Track absolute customer churn count alongside the percentage. A SaaS Capital cohort study showed that 40% of companies that hit a churn cliff after a growth slowdown had been masking the problem for 12+ months during fast growth.
Annual contracts hiding monthly issues. If 70% of your customers are on annual contracts, your reported monthly churn looks great because most contracts simply haven’t reached renewal yet. The real churn signal is renewal rate, not monthly cancellation rate, for annual-heavy customer bases.
Trial-to-paid leakage misclassified. Companies that auto-charge after trial conversion sometimes count post-trial cancellations as churn, which inflates the number. Separate “first 30-day cancellations” from “established customer churn” and report both. The first is an acquisition or onboarding problem; the second is a product or success problem.
Net retention masking gross retention. NRR at 115% looks healthy, but if GRR is 75% and the gap is bridged by frantic expansion to a small number of large accounts, the business is structurally fragile. Concentrated expansion plus high gross churn is a typical pattern in companies six to twelve months before a public retention reset.
Segment-mix effects. As your customer base shifts toward enterprise (lower churn) the blended SaaS churn rate falls even if neither segment improves. Always cohort by segment before drawing conclusions about whether retention work is paying off.
Cohort Retention Curves: the Real Picture
Headline SaaS churn rate numbers hide cohort behavior. Two companies can both report 4% monthly churn, but one has a flat retention curve (customers leave evenly across months) and the other has a steep early drop followed by a flat tail (customers either stick forever or leave fast). The shape matters more than the headline number.
Look at week-1, week-4, and month-3 retention as a cohort progression. A healthy SMB SaaS retention curve typically lands around 70% week-1, 50% week-4, and 35 to 40% month-3, then flattens. The flattening is the important part. If month-3 to month-12 retention also drops sharply, you don’t have a stable customer base, you have a transactional one. ChartMogul’s 2025 cohort study across 6,000+ SaaS companies showed that companies with flat post-month-3 retention curves grew ARR 2.4x faster over 24 months than those with declining curves at the same headline churn rate.
The diagnostic value: if your headline SaaS churn rate is 3% but the curve is dropping every month, your real long-run churn is closer to 5%. If your headline is 5% but the curve flattens after month-3, your real long-run churn is closer to 2.5%. The first is a worse business than it looks. The second is a better one.
How Pricing Changes Churn Measurement
| Pricing model | Measurement issue |
|---|---|
| Monthly subscription | Cancellation can appear every month; annualize with compounding |
| Annual contract | Logo churn appears at renewal while contraction can occur earlier |
| Per-seat | Seat contraction can reduce NRR without a lost logo |
| Usage-based | Lower usage may be contraction before cancellation |
| Hybrid | Separate platform, seat, and usage components |
Compare like contract terms and customer segments. A monthly self-serve logo churn rate is not directly comparable with annual enterprise GRR.
FAQs
What is a good SaaS churn rate?
There is no universal rate. Compare the same logo or revenue metric, period, customer segment, contract length, ACV, and company stage.
What are current private SaaS retention benchmarks?
SaaS Capital’s 2026 bootstrapped B2B SaaS cohort with $3 million to $20 million ARR reported median NRR of 103% and median GRR of 91%. Those are annual revenue-retention measures for that cohort, not monthly logo churn.
How do you calculate customer churn?
Customer churn equals customers lost during the period divided by customers at the start of the period. Define pauses, reactivations, mergers, trials, and nonpaying accounts first.
How do you annualize monthly churn?
Use 1 minus (1 minus monthly churn) raised to the 12th power. Multiplying by 12 ignores compounding.
What is the difference between GRR and NRR?
GRR includes churn and contraction but excludes expansion, so it cannot exceed 100%. NRR includes expansion from the starting customer cohort and can exceed 100%.
How should churn be reduced?
Segment by fit, activation, customer age, usage, payment status, contract, support history, and cancellation reason, then fix the mechanism shown by that cohort.
Does lower churn guarantee a higher valuation?
No. Retention matters, but growth, margin, market, concentration, contract quality, cash flow, and capital conditions also affect valuation.
Tell Google you want more of this.
Add Gatilab as a preferred sourceOne tap, and this site shows up more often in your own Top Stories, AI Overviews and AI Mode. Remove it any time.