
Ecommerce Checkout Optimization: 9 Fixes That Recover Lost Orders
Ecommerce checkout optimization is the most profitable work on any online store, and most teams skip it because the wins live behind a flow that already “works.” It doesn’t work. The Baymard Institute pegs the average documented cart abandonment rate at 70.22 percent across 50 studies, which means seven out of every ten people who added an item never finished paying. Winning back even a slice of that group is usually cheaper than buying new traffic to replace it.
The same five problems can show up on any stack, whether it’s Shopify, WooCommerce, Magento, BigCommerce, or custom code: forced account creation, hidden shipping costs revealed at step three, no express payment options, six-field address forms that ignore autofill, and zero trust signals near the pay button. Those five are where this guide starts.
The cheapest revenue lift in ecommerce isn’t a new ad channel. It’s the seven steps between “add to cart” and “order confirmed” that you’ve never timed end-to-end on a real device.
Why Checkout Breaks (and Where the Money Leaks)
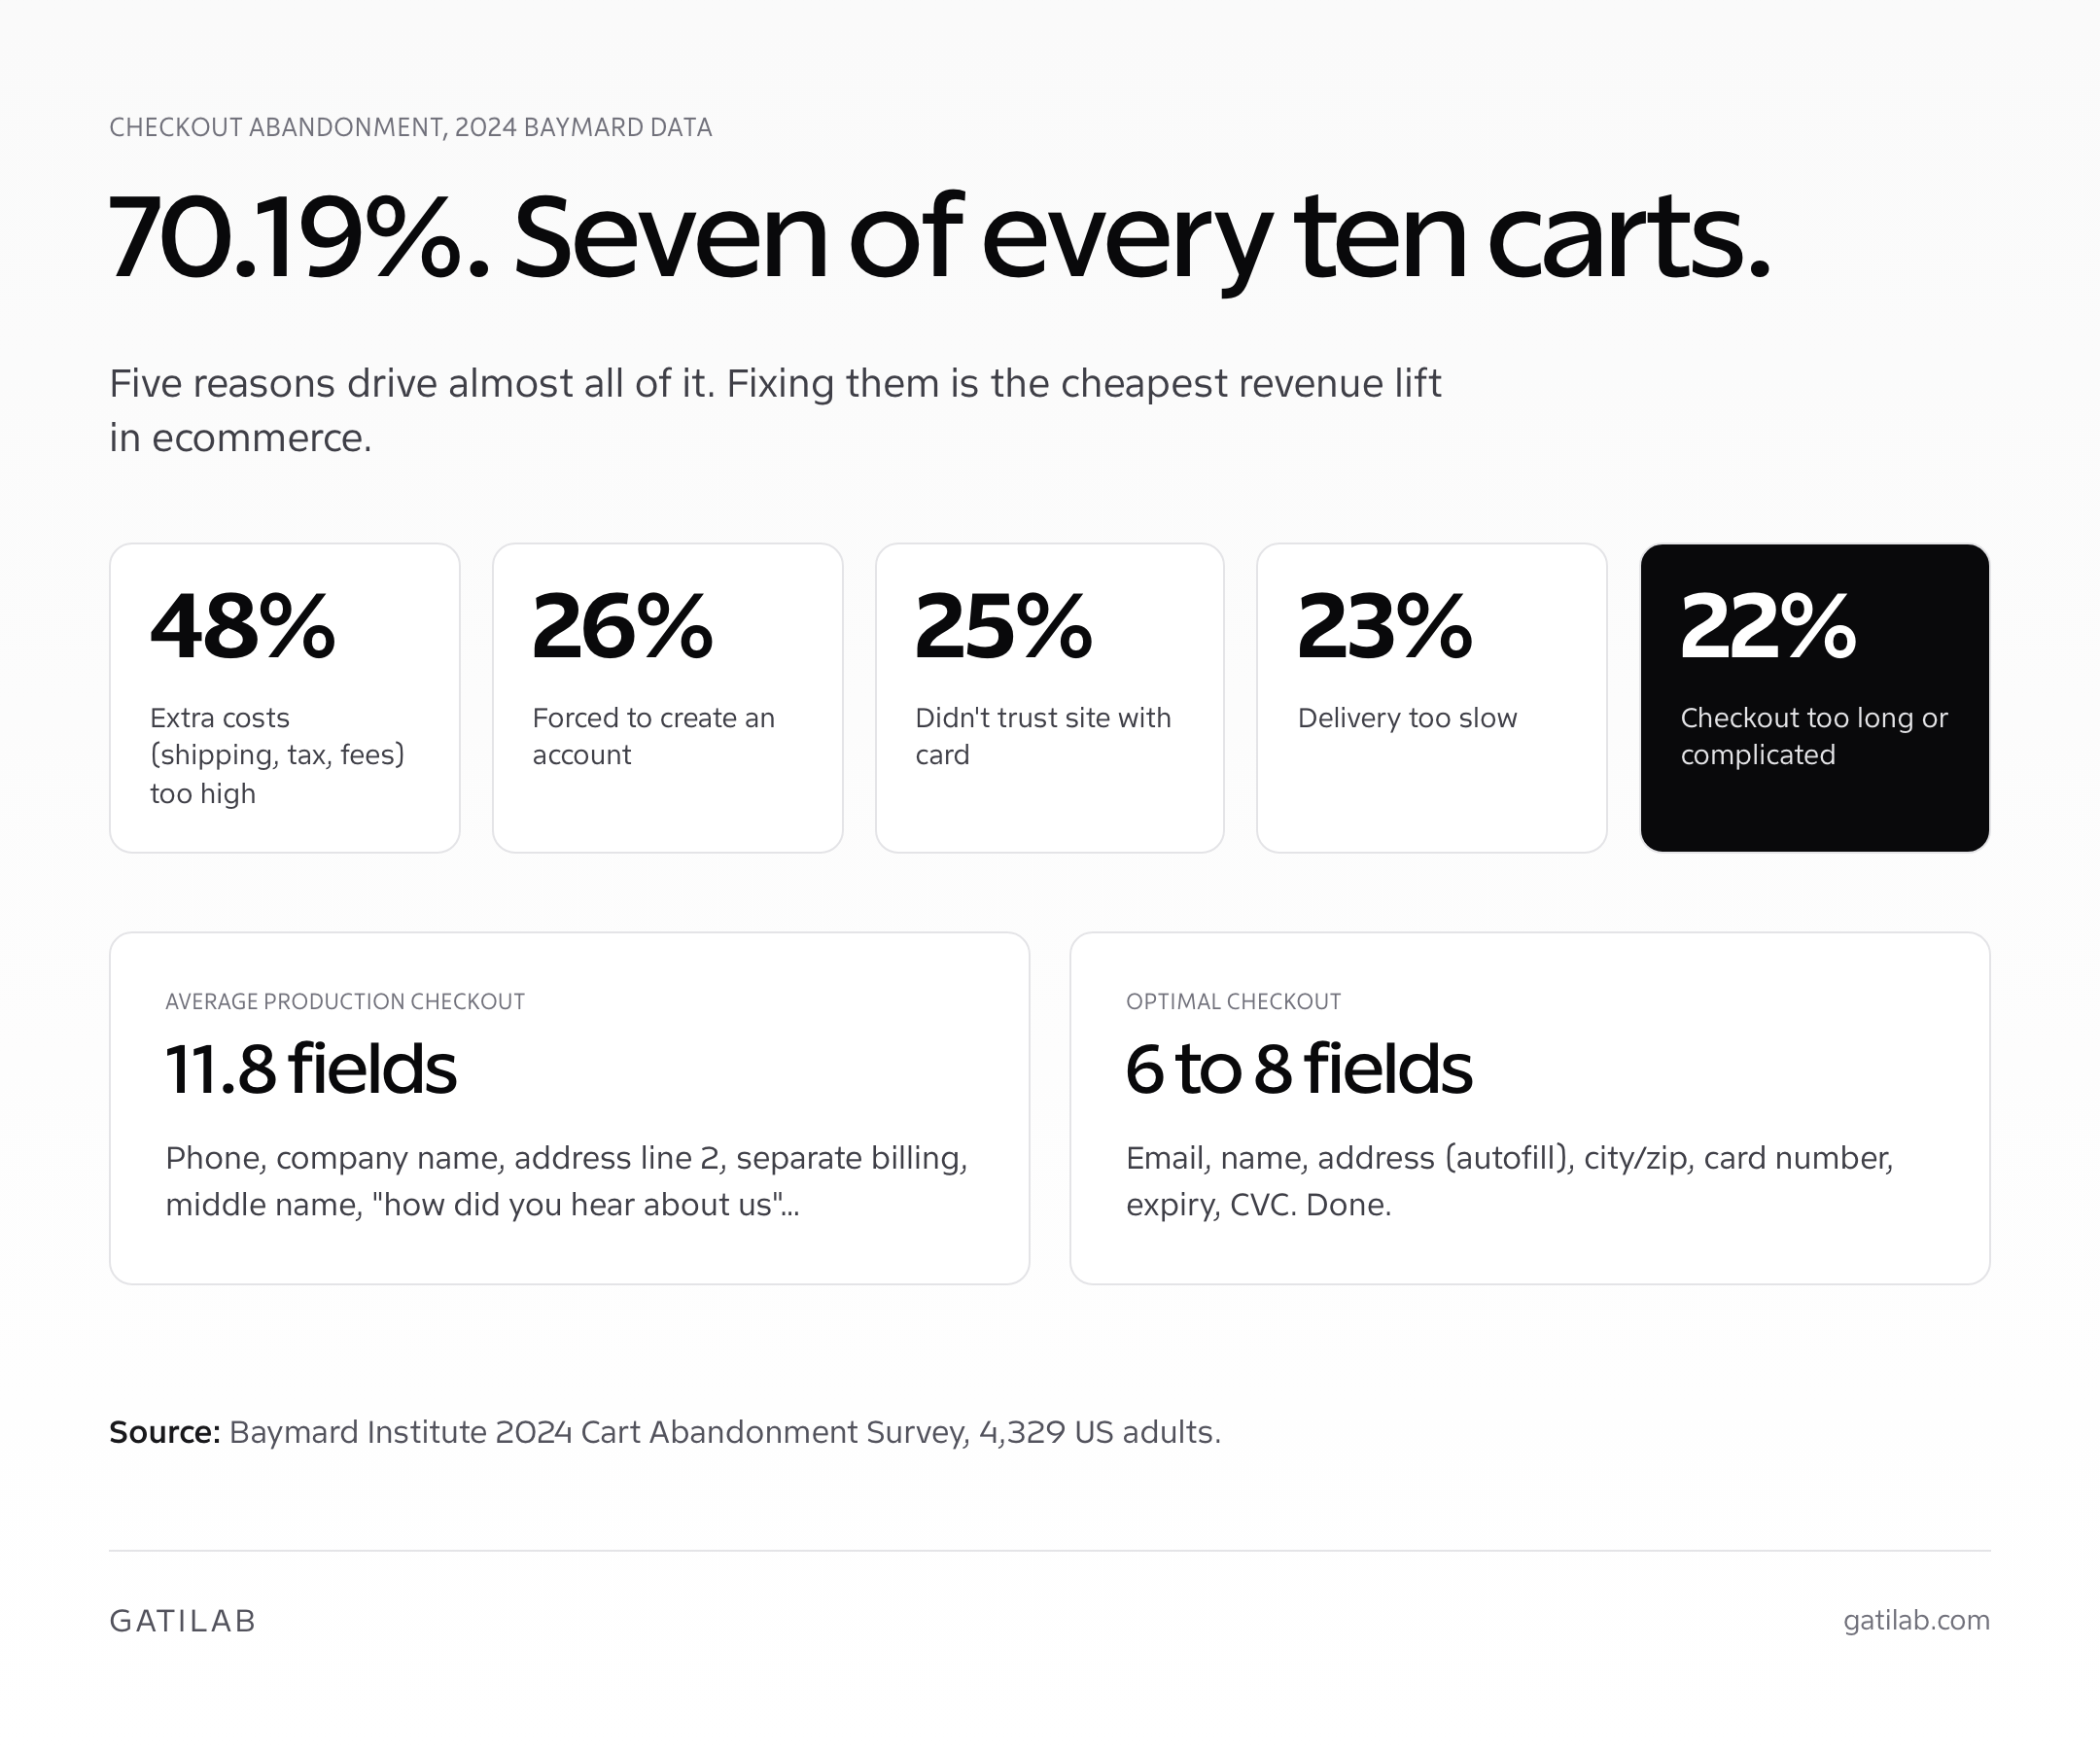
Checkout breaks because every extra screen, every unexpected fee, and every form field that fights autofill compounds doubt at the exact moment a buyer needs reassurance. Baymard’s checkout benchmark finds the average US checkout shows 14.88 form fields by default, against an ideal of 7 to 8. Each redundant field adds friction, and the worst offenders ask for a phone number, a “company name,” and a billing address that almost always matches the shipping address the user just typed.
The leak isn’t randomly distributed across the funnel either. Ecommerce checkout optimization works because the leak points are consistent across stores. Baymard’s latest abandonment survey of US shoppers, leaving out those who were just browsing, puts extra costs (shipping, taxes, fees) at 40 percent; slow delivery at 20 percent; not trusting the site with a card at 19 percent; being asked to create an account at 18 percent; and a too long or complicated checkout at 17 percent. Those five categories cover the work. Everything below maps to one of them.
- Hidden costs surfaced too late. Shipping, tax, and surcharges should appear on the cart page, not three clicks into checkout. Extra costs are the top abandonment reason in Baymard’s survey.
- Forced account creation. In Baymard’s survey, 18 percent of US shoppers who abandoned did so because the site wanted them to create an account. Account creation belongs after the order, not before it.
- Trust gaps near the pay button. No SSL badge, no return policy snippet, no recognizable payment logos, no support contact. Buyers paying with a stranger’s site need three of those four within a thumb’s reach.
- Form friction. Address fields that don’t autofill, postal codes that reject valid formats, phone fields demanded for digital products, country dropdowns that scroll to “Afghanistan” first. Each one gives a tired mobile buyer another reason to quit.
- No express payment. Shop Pay, Apple Pay, Google Pay, PayPal Express, Amazon Pay. Without them, mobile buyers have to type card and address details on a small screen.
If you haven’t pressure-tested the rest of the funnel, my conversion-optimized web pages guide covers the structural fixes that should land before any checkout work.
Cart Abandonment Benchmarks for 2026
Cart abandonment varies sharply by industry, device, and traffic source, and benchmarking against the wrong cohort produces complacent decisions. The Baymard Institute’s 50-study average of 70.22 percent is the right ceiling reference, but the practical comparison is your sub-vertical and your device split. Mobile usually abandons more than desktop, and closing that gap is often the single biggest fix.
| Vertical | Abandonment driver to check first |
|---|---|
| Fashion and apparel | Shipping cost surfaced too late |
| Beauty and cosmetics | Forced account creation |
| Consumer electronics | Comparison shopping mid-flow |
| Home and furniture | Delivery time and cost |
| Food and grocery | Delivery slot availability |
| B2B / wholesale | Quote vs cart confusion |
| Digital products / SaaS one-time | Trust signals missing |
Use these as starting hypotheses for your diagnostic, not as benchmarks. Your real target is to beat your own four-week trailing average.
Single-Page vs Multi-Step Checkout (and When Each Wins)
The single-page versus multi-step debate has a clean answer and a messy one. The clean answer: Baymard’s checkout research found that users had few problems moving between steps. The usability issues came from what they had to do at each step, so a well-built multi-step checkout performs about as well as a one-page one. Single-page tends to suit simple carts (one to three items, one shipping address, one payment method) and on returning customers. Multi-step tends to suit complex carts (mixed shipping rules, gift options, coupon math) and on first-time visitors who need to feel forward progress.
The messy answer: most “single-page” checkouts you’ll see on Shopify are really single-page accordions with three collapsed sections (contact, shipping, payment), and most “multi-step” checkouts on WooCommerce are really three pages with the cart still visible on each. The format itself doesn’t drive conversion. The number of distinct decisions the buyer has to make does.
- Pick single-page when: average order has 1 to 3 items, you sell to repeat customers more than 50 percent of the time, your average order value is under $200, and you have express payment buttons placed above the form.
- Pick multi-step when: average order is $300 plus with multiple shipping options, you offer gift wrap or installation services, you require business tax IDs or VAT numbers, or your customer base skews older (55 plus) where progress indicators help buyers feel in control.
- Either works when: your form has fewer than 8 fields, your express payment buttons load above the fold, and you can complete the flow on a 6.1-inch mobile screen in under 90 seconds with autofill engaged.
The instrumented answer: A/B test it. Most teams skip the test because “single-page is the modern pattern” or “multi-step shows progress.” Both are folklore. Read the results by device, because a variant can win on desktop and lose on mobile, and it’s fine to ship a different flow to each.
Guest Checkout: The Single Highest-ROI Fix
Guest checkout is the cheapest ecommerce checkout optimization win on most stores. In Baymard’s latest abandonment survey, 18 percent of US shoppers (leaving out those just browsing) abandoned because the site wanted them to create an account. On Shopify and WooCommerce it’s a settings change. On custom stacks it can take real engineering time, because customer records thread through the order pipeline.
The pattern that works well: collect email at the start of checkout, complete the order as a guest, then offer one-click account creation on the thank-you page with a checkbox that says “Save my details for next time.” The post-purchase opt-in asks for the account after the order has cleared, so it costs you nothing in revenue terms.
Express Payment: Shop Pay, Apple Pay, Google Pay, PayPal
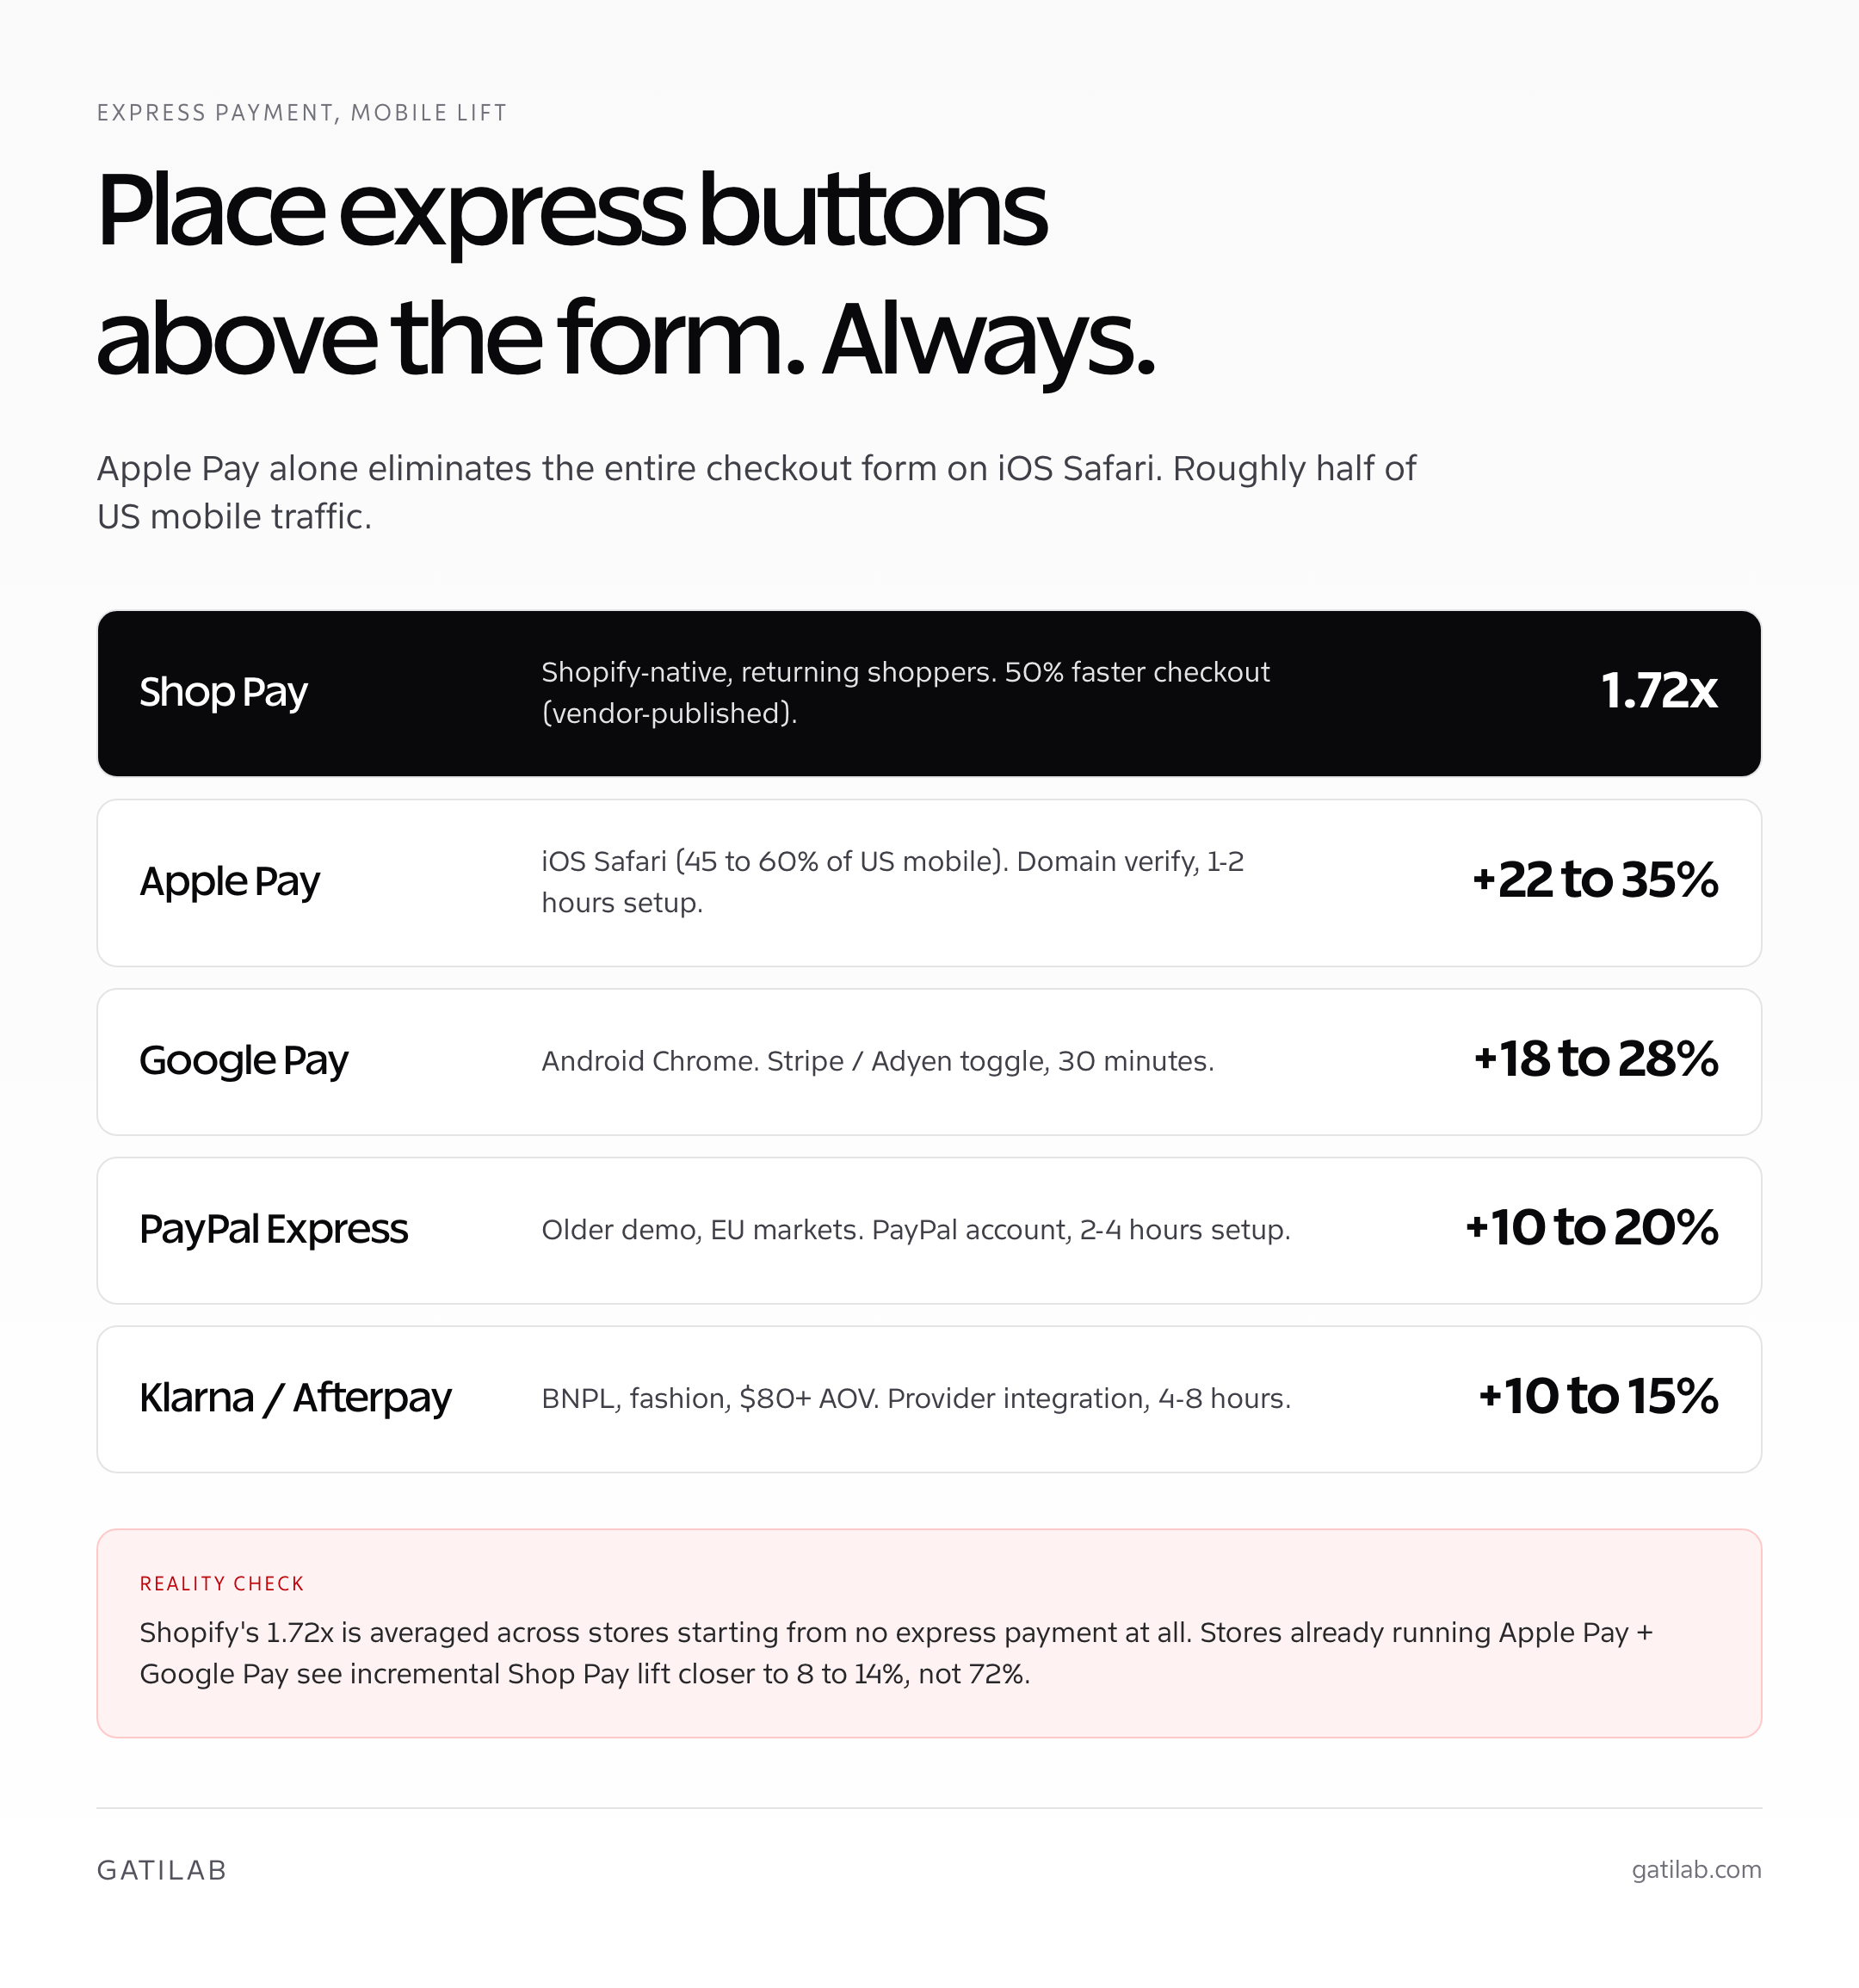
Express payment options are the single largest mobile ecommerce checkout optimization lift available in 2026, and they’re table stakes for any store selling on mobile. Shopify says Shop Pay can lift conversion by as much as 50 percent compared to guest checkout, citing an independent study by a global management consulting firm. The number is vendor-published, so treat it as a ceiling rather than an expected lift.
Place express payment buttons above the standard form, not below. The pattern that wins: a row of three to four express buttons at the top of the checkout screen (Shop Pay, Apple Pay, Google Pay, PayPal), then a horizontal divider with the text “or pay with card,” then the standard form. Buyers who want one-tap convenience tap the top row. Buyers who don’t trust express payments scroll past it. Burying express buttons below the form measurably hurts both groups.
| Express method | Where it shines | Setup |
|---|---|---|
| Shop Pay | Shopify-native stores, returning shoppers | Toggle on in Shopify Payments |
| Apple Pay | iPhone and Safari shoppers | Domain verification with your processor |
| Google Pay | Android and Chrome shoppers | Toggle in Stripe, Adyen, or your processor |
| PayPal Express | Shoppers who already keep a PayPal balance or account | PayPal business account |
| Amazon Pay | Shoppers loyal to Amazon | Amazon Pay merchant account |
| Klarna / Afterpay | Buy now, pay later on higher-value carts | Provider integration |
Apple Pay is the highest-priority addition for US and UK stores because it eliminates the entire checkout form for iPhone shoppers. Domain verification with your payment processor is a short setup step. Anyone running on Stripe, Adyen, Braintree, or Shopify Payments has Apple Pay support already wired; you just need to flip it on and verify the domain.
Heads-up: Shop Pay only works inside the Shopify ecosystem. If you’re considering migrating from WooCommerce to Shopify primarily for Shop Pay, run the math against migration cost. Shopify’s “up to 50 percent” figure is a vendor number measured against guest checkout. A store already running Apple Pay and Google Pay through Stripe starts from a better baseline, so its extra gain from Shop Pay will be smaller.
Address Autofill, Form Fields, and Mobile Keyboards
Address autofill is the second-cheapest ecommerce checkout optimization on most stores, after enabling guest checkout. Google Places Autocomplete and the equivalent libraries from Mapbox, Loqate, and Smarty cut the slowest part of a mobile checkout: typing a full address. The implementation is roughly 40 lines of JavaScript on a custom stack, a one-click app install on Shopify (e.g., Address Validator), or a free plugin on WooCommerce.
Form field optimization compounds on top of autofill. Baymard’s ideal checkout shows 7 to 8 form fields. The average US checkout in its benchmark shows about 15. Cut by removing the obvious bloat: phone number for non-physical orders, “company name” for B2C, separate billing address checkbox (default to “same as shipping”), middle name, “address line 2” placed inline with line 1, and any field that has more than 18 percent skip-rate in your form analytics.
- Use the right input types.
type="email",type="tel",inputmode="numeric"on postal code and card number. The mobile keyboard changes for each, saving the buyer real seconds per field. - Set autocomplete attributes.
autocomplete="given-name",family-name,email,tel,street-address,postal-code,cc-number,cc-exp,cc-csc. Browser autofill only works when these are set correctly. - Don’t split fields that are one input. Phone number is one field, not three. Card number is one field, not four. The browser handles the formatting; you just store the raw value.
- Inline-validate, never on submit. Show field-level errors as the buyer leaves the field, not after they hit “Place Order.”
- Default the country to the buyer’s IP geolocation. A US shopper on a Brazilian store should still see “United States” pre-selected if the store ships there, with Brazil as a one-tap switch.
For deeper form-level work (field analytics, error tracking, abandonment heatmaps), pair this with my form optimization guide. The patterns there extend beyond checkout into lead forms and signup flows but the analytics layer is shared.
Trust Signals: What Belongs Near the Pay Button
Trust signals near the pay button are the work that speaks to the 19 percent of shoppers in Baymard’s survey who abandoned because they didn’t trust the site with their card. The signals worth adding are not the cookie-cutter “Norton Secured” badges from 2014. They’re concrete, scannable answers to the four questions a hesitant buyer asks at the pay step: is my card safe, can I return this, who do I email if something breaks, and have other people bought from here recently.
- SSL and PCI badges placed inline next to the card field, not in the footer. The buyer doesn’t scroll to find them.
- Payment logos visible above the form (Visa, Mastercard, Amex, Apple Pay, PayPal).
- One-line return policy snippet (“30-day free returns”) next to the order summary, not buried in a footer link.
- Real support contact (email and live chat link) visible inside the checkout, not just on the pre-checkout pages. The number of stores that hide support contact at checkout is criminal.
- Recent purchase or social proof microcopy (“1,247 customers ordered this week”) if you can populate it accurately. Don’t fake it. Buyers see through faked urgency, and the 2024 FTC fake-review rules apply to checkout urgency claims too.
- Money-back guarantee text in plain language. “If it doesn’t fit, ship it back free for 60 days. No questions, no restocking fee.”
Place these signals visually adjacent to the action they support. SSL and payment logos go next to the card field. Return policy and support contact go next to the order summary. The shopper’s eye moves between those two zones during checkout; trust copy that lives anywhere else won’t be read.
A/B Testing Your Checkout Flow
A/B testing checkout is the highest-stakes experimentation surface on any ecommerce store, and most teams either skip it (too risky) or run it badly (one variant change at a time across 40,000 sessions over six months). The right approach: pick one of the five known abandonment drivers, ship a hypothesis-driven variant against it, set a clear minimum detectable effect, run for at least one full business cycle (14 days minimum), and don’t peek at the data before then.
The tests most worth running first: enabling guest checkout, repositioning express payment buttons above the form, cutting form fields toward Baymard’s 7 to 8, surfacing shipping costs on the cart page rather than step three, and testing single-page versus multi-step on mobile alone (results vary; ship the winner).
For the experimentation tooling itself, my deeper coverage of A/B testing tools walks through the picks for ecommerce stacks specifically. VWO, AB Tasty, and Convert all support visual checkout variants without code; for engineering-led teams running statistical rigor, GrowthBook and Statsig are the picks. The right tool depends on whether marketing or engineering owns the experiment surface.
Heads-up: never run a checkout test with less than 1,000 conversions per variant. Below that sample size, the noise eats the signal, and you’ll ship a “winner” that reverses on the next cycle. If you don’t have the volume, queue the test for a peak-traffic window or extend the runtime. The most expensive checkout test is the one that ships a false positive into production.
A 30-Day Checkout Optimization Plan
If you’re starting from a checkout that hasn’t been touched since launch, here’s the order of operations that works. The pattern compounds: each fix makes the measurement clearer for the next one. Skip the diagnostic week and you’ll waste budget on tests that fail because the prerequisite wasn’t in place.
- Days 1 to 5: Diagnostic. Install Microsoft Clarity (free) and a form analytics tool. Record 200 to 500 sessions through checkout. Identify the top three abandonment screens and the top three form fields with skip or error rates above 15 percent.
- Days 6 to 10: Quick wins. Enable guest checkout. Surface shipping costs on the cart page. Add Apple Pay and Google Pay above the form. Set autocomplete attributes on every field. These four ship without an A/B test in most cases because they’re known wins.
- Days 11 to 14: Form trim. Remove 3 to 5 fields you can defend cutting. Default billing-equals-shipping. Pre-select country from IP. Inline-validate everything. Re-test with Clarity on a fresh 200-session window.
- Days 15 to 21: First A/B test. Pick the most promising hypothesis from your diagnostic (usually single-page vs multi-step on mobile, or shipping-cost-on-cart vs at-step-three). Ship a clean variant. Run for 14 days minimum.
- Days 22 to 30: Trust signals and second test. Place SSL, payment logos, return policy, and support contact in the right zones. Queue a second A/B test on the next-highest hypothesis. Document the wins and losses in a shared file so the next iteration starts from data, not from memory.
On a store with no express payment, the express payment work is the likeliest biggest single jump. Stores already running Apple Pay usually have more to gain from form trim or shipping transparency. The rank order of fixes depends on the diagnostic, not on a generic playbook.
Tools and Platforms by Stack
The right ecommerce checkout optimization tools depend on which platform you’re on, what data you already collect, and how much of the work needs to happen without engineering bandwidth. For most stores under $5M annual revenue, the toolchain that ships meaningful work in 30 days is small.
- Diagnostics (free): Microsoft Clarity for unlimited heatmaps and session replay, GA4 for funnel measurement.
- Form analytics: Zuko for field-level abandonment tracking (from £40 per month billed yearly), or Hotjar, whose plans are now sold as Contentsquare Experience Analytics (Growth from $49 per month billed annually), if you want heatmaps and forms in one tool.
- A/B testing: Convert from $299 per month billed annually, VWO for marketing-led mid-market teams (see current pricing), and GrowthBook, free and open source when self-hosted, for engineering-led stacks.
- Address autofill: Google Places Autocomplete (paid by request volume), Loqate for global, or Shopify’s built-in address suggestions.
- Express payment: Stripe (Apple Pay, Google Pay, Link), Shopify Payments (Shop Pay, Apple Pay, Google Pay), PayPal, Amazon Pay, Klarna, Afterpay. Most are toggle-on with the payment processor you already use.
For a FluentCart store, GT Extensions for FluentCart adds optional checkout designs, product add-ons, conditional fields, and local-currency workflows. FluentCart still handles the transaction, so review the cart, gateway, and final order together.
For a WooCommerce store, Stackless for WooCommerce, a plugin I built, covers the checkout fixes in this article from one plugin: 5 ready-made checkout layouts for the Checkout block and the classic checkout, consent checkboxes with stored proof, a shorter checkout for virtual-only carts, order bumps with take rates, and buy links that open checkout with the cart and coupon filled in. Its WooCommerce Optimizer module also stops WooCommerce prefetching about 50 checkout scripts on every page once the cart has items, which helps the speed problem in the note below.
For a broader view of the experimentation and analytics layer, the best CRO tools writeup walks through the full stack across analytics, heatmaps, A/B testing, surveys, personalization, and form analytics. Checkout work pulls from the same toolchain.
If your store is bleeding speed before checkout (LCP above 3.5 seconds, TTFB above 800ms), checkout fixes won’t compound. Server response time alone caps your conversion ceiling. My ecommerce-grade hosting picks cover the infrastructure layer that has to be in place first.
Common Checkout Optimization Mistakes
These mistakes tend to travel together, and an underperforming checkout often makes several at once. Fixing them is rarely a redesign; it’s a sequence of 30-minute changes shipped in the right order with measurement before and after.
- Optimizing the desktop checkout when most of your traffic is mobile. Always start with the mobile audit. Desktop is the smaller surface for almost every B2C store in 2026.
- Treating Shopify’s Shop Pay claim as your expected lift. The vendor number compares Shop Pay with guest checkout. Your extra gain is likely lower if you already have Apple Pay and Google Pay.
- Running A/B tests with sample sizes too small to be conclusive. Below 1,000 conversions per variant, the noise wins. Either queue tests for peak traffic or extend runtime.
- Adding trust badges that aren’t recognized. A “TrustLock” badge from a vendor nobody knows lowers trust, not raises it. Stick to logos buyers actually recognize: Visa, Mastercard, Amex, Apple Pay, PayPal, BBB if applicable.
- Not measuring before the change. Without a 30-day baseline, you can’t tell if a checkout fix actually moved the metric or if seasonality did.
- Surfacing all the shipping options at once. Show the recommended option pre-selected, with a “see other options” expander. Buyers shouldn’t have to choose between four shipping methods on a screen they didn’t open to think about logistics.
If you’ve already optimized checkout and are ready to recover the abandoners themselves, my exit-intent popup playbook covers the post-cart recovery layer.
FAQs on Checkout Optimization
What is ecommerce checkout optimization?
Ecommerce checkout optimization is the systematic work of removing friction from the path between cart and order confirmation, so more shoppers complete their purchase. It covers form-field reduction, express payment options (Shop Pay, Apple Pay, Google Pay, PayPal), guest checkout, address autofill, trust signals near the pay button, and A/B testing of single-page versus multi-step flows.
What is the average cart abandonment rate?
The Baymard Institute’s average across 50 published studies puts the documented cart abandonment rate at 70.22 percent. The rate varies by vertical, device, and traffic source, and mobile usually abandons more than desktop, so benchmark against your own segments and your own trailing average.
Should I use single-page or multi-step checkout?
Use single-page checkout when average orders have 1 to 3 items, AOV is under $200, and your audience skews younger and mobile-heavy. Use multi-step when AOV is $300 plus, orders include shipping options or gift wrap, or your customer base is older where progress indicators reduce anxiety. Either format works when the form has fewer than 8 fields, express payment buttons load above the fold, and the flow completes in under 90 seconds on mobile with autofill.
How much does Shop Pay actually lift conversions?
Shopify says Shop Pay can lift conversion by as much as 50 percent compared to guest checkout, citing an independent study by a global management consulting firm. It’s a vendor number measured against guest checkout, so a store that already offers Apple Pay and Google Pay should expect less. Treat it as a ceiling, not an expected lift.
What are the most important trust signals at checkout?
The trust signals worth adding are: SSL and PCI badges placed inline next to the card field (not in the footer), recognizable payment logos visible above the form (Visa, Mastercard, Amex, Apple Pay, PayPal), a one-line return policy snippet next to the order summary, real support contact (email and live chat) inside the checkout, and a money-back guarantee in plain language. Generic Norton-style trust badges from unrecognized vendors typically lower trust rather than raise it.
How many fields should an ecommerce checkout have?
Baymard’s ideal checkout shows 7 to 8 form fields, while the average US checkout in its benchmark shows about 15. Cut fields you can’t defend: phone number for non-physical orders, company name for B2C, separate billing address (default to same-as-shipping), middle name, and any field with skip rate above 18 percent in form analytics.
Does enabling guest checkout actually help?
Yes. In Baymard’s latest abandonment survey, 18 percent of US shoppers (leaving out those just browsing) abandoned a checkout because the site wanted them to create an account. The pattern that works best: collect email at checkout start, complete the order as a guest, then offer one-click account creation on the thank-you page. The account ask then costs nothing, because the order has already cleared.
Can I A/B test my checkout flow safely?
Yes, with discipline. Run only one variant change at a time. Use VWO, Convert, AB Tasty, or GrowthBook depending on your stack. Never run a checkout test with fewer than 1,000 conversions per variant; below that, noise eats the signal and you’ll ship false positives. Run for at least one full business cycle (14 days minimum) regardless of how the data looks at day three. The tests most worth running first: enabling guest checkout, repositioning express payment buttons above the form, reducing form fields, and surfacing shipping costs on the cart page.
How long does ecommerce checkout optimization take to show results?
The quick wins can show up in your funnel data within the first 30 days: enable guest checkout, surface shipping costs on the cart page, add Apple Pay and Google Pay above the form, set autocomplete attributes, trim form fields to 7 or 8, and ship trust signals near the pay button. On stores with no express payment, that work usually brings the biggest single jump. Results compound: each fix makes the measurement clearer for the next one.
What are the best ecommerce checkout optimization tools?
For diagnostics: Microsoft Clarity (free) for unlimited heatmaps and session replay, GA4 for funnel measurement. For form analytics: Zuko (from £40 per month billed yearly) or Hotjar, now sold as Contentsquare Experience Analytics (Growth from $49 per month billed annually). For A/B testing: Convert (from $299 per month billed annually), VWO (see its current pricing page), or GrowthBook, which is free and open source when self-hosted. For address autofill: Google Places Autocomplete or Loqate for global coverage. Most express payment options (Shop Pay, Apple Pay, Google Pay) are toggles in the payment processor you already use.
Tell Google you want more of this.
Add Gatilab as a preferred sourceOne tap, and this site shows up more often in your own Top Stories, AI Overviews and AI Mode. Remove it any time.