
Entrepreneurship Statistics for 2026 (65+ Facts)
Entrepreneurship statistics are easy to distort because surveys, business registrations, establishments, self-employment records, and venture databases measure different populations. This page keeps the denominator beside each figure.
These aren’t random data points. Every stat below connects to something I’ve seen play out with real money on the line. I’ll tell you what the numbers mean, where they mislead, and what I got wrong along the way.
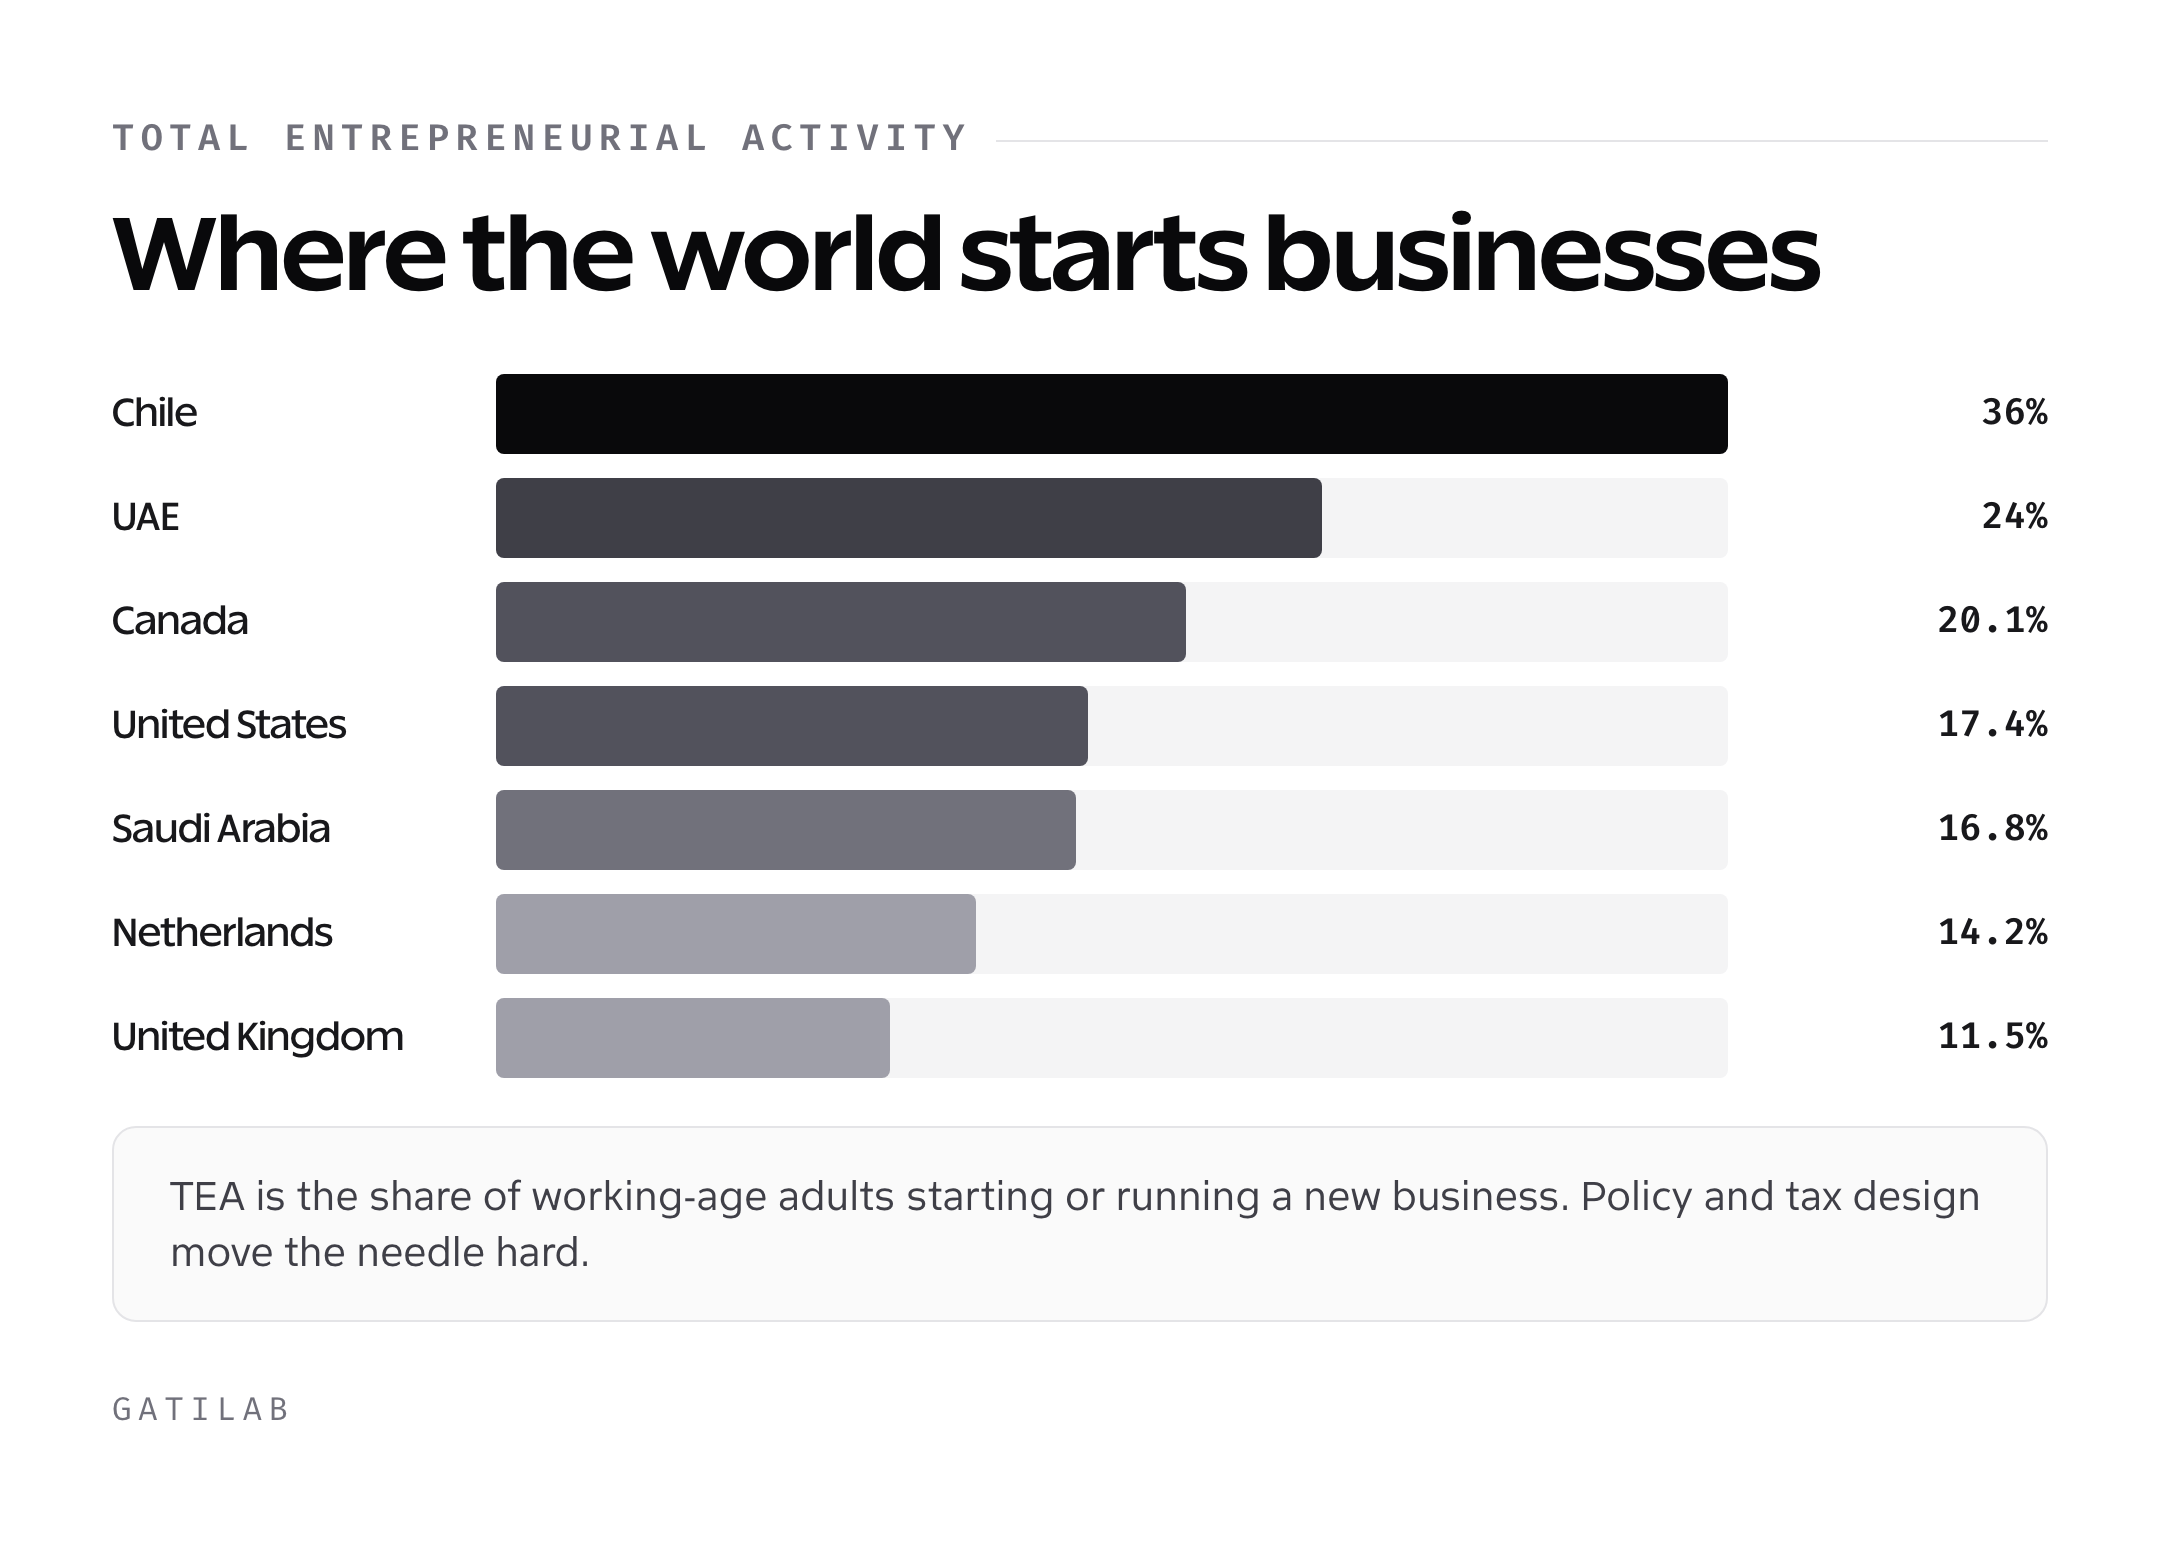
Global Entrepreneurship Statistics
The 2025/2026 Global Entrepreneurship Monitor report draws on more than 160,000 adults across 53 economies representing about 43% of the global population and 57% of global GDP. It measures people, intentions, early-stage activity, established ownership, and ecosystem conditions rather than pretending every entrepreneur belongs to one global business count.
| GEM 2025/2026 finding | Value | Denominator |
|---|---|---|
| Early-stage entrepreneurs considering social or environmental impact | 84% | Early-stage entrepreneurs in the GEM reporting set |
| Adults deterred by fear of failure | 2 in 5 | Adults seeing an opportunity, as summarized by GEM |
| Economies with insufficient provision and access to entrepreneurial finance | 36 of 53 | Participating economies |
| Middle-income economies at or near startup gender parity | 9 of 23 | Middle-income participating economies |
| Economies sufficient across all 13 framework conditions | 4 | India, Lithuania, Saudi Arabia, and the UAE |
The report is survey-based and economy-specific. Use its definitions before comparing a country’s early-stage activity rate with a count of registered firms. GEM global report
How Entrepreneurship Rates Are Compared
GEM’s Total early-stage Entrepreneurial Activity rate measures adults involved in a nascent business or a new business up to 3.5 years old. Established Business Ownership uses a different phase. A country can rank high on startup activity and still have a large gap before those ventures become established.
Compare the same indicator, survey year, age range, and economy group. Do not rank countries by mixing GEM survey rates, company registrations, self-employment, and business applications.
Use the global rates as context, then return to the operating decision. The supporting guides cover US small businesses, agreements for small businesses, margins in service businesses, cash flow for business owners, consultant niche selection, and Customer acquisition cost.
Startup Survival Rates
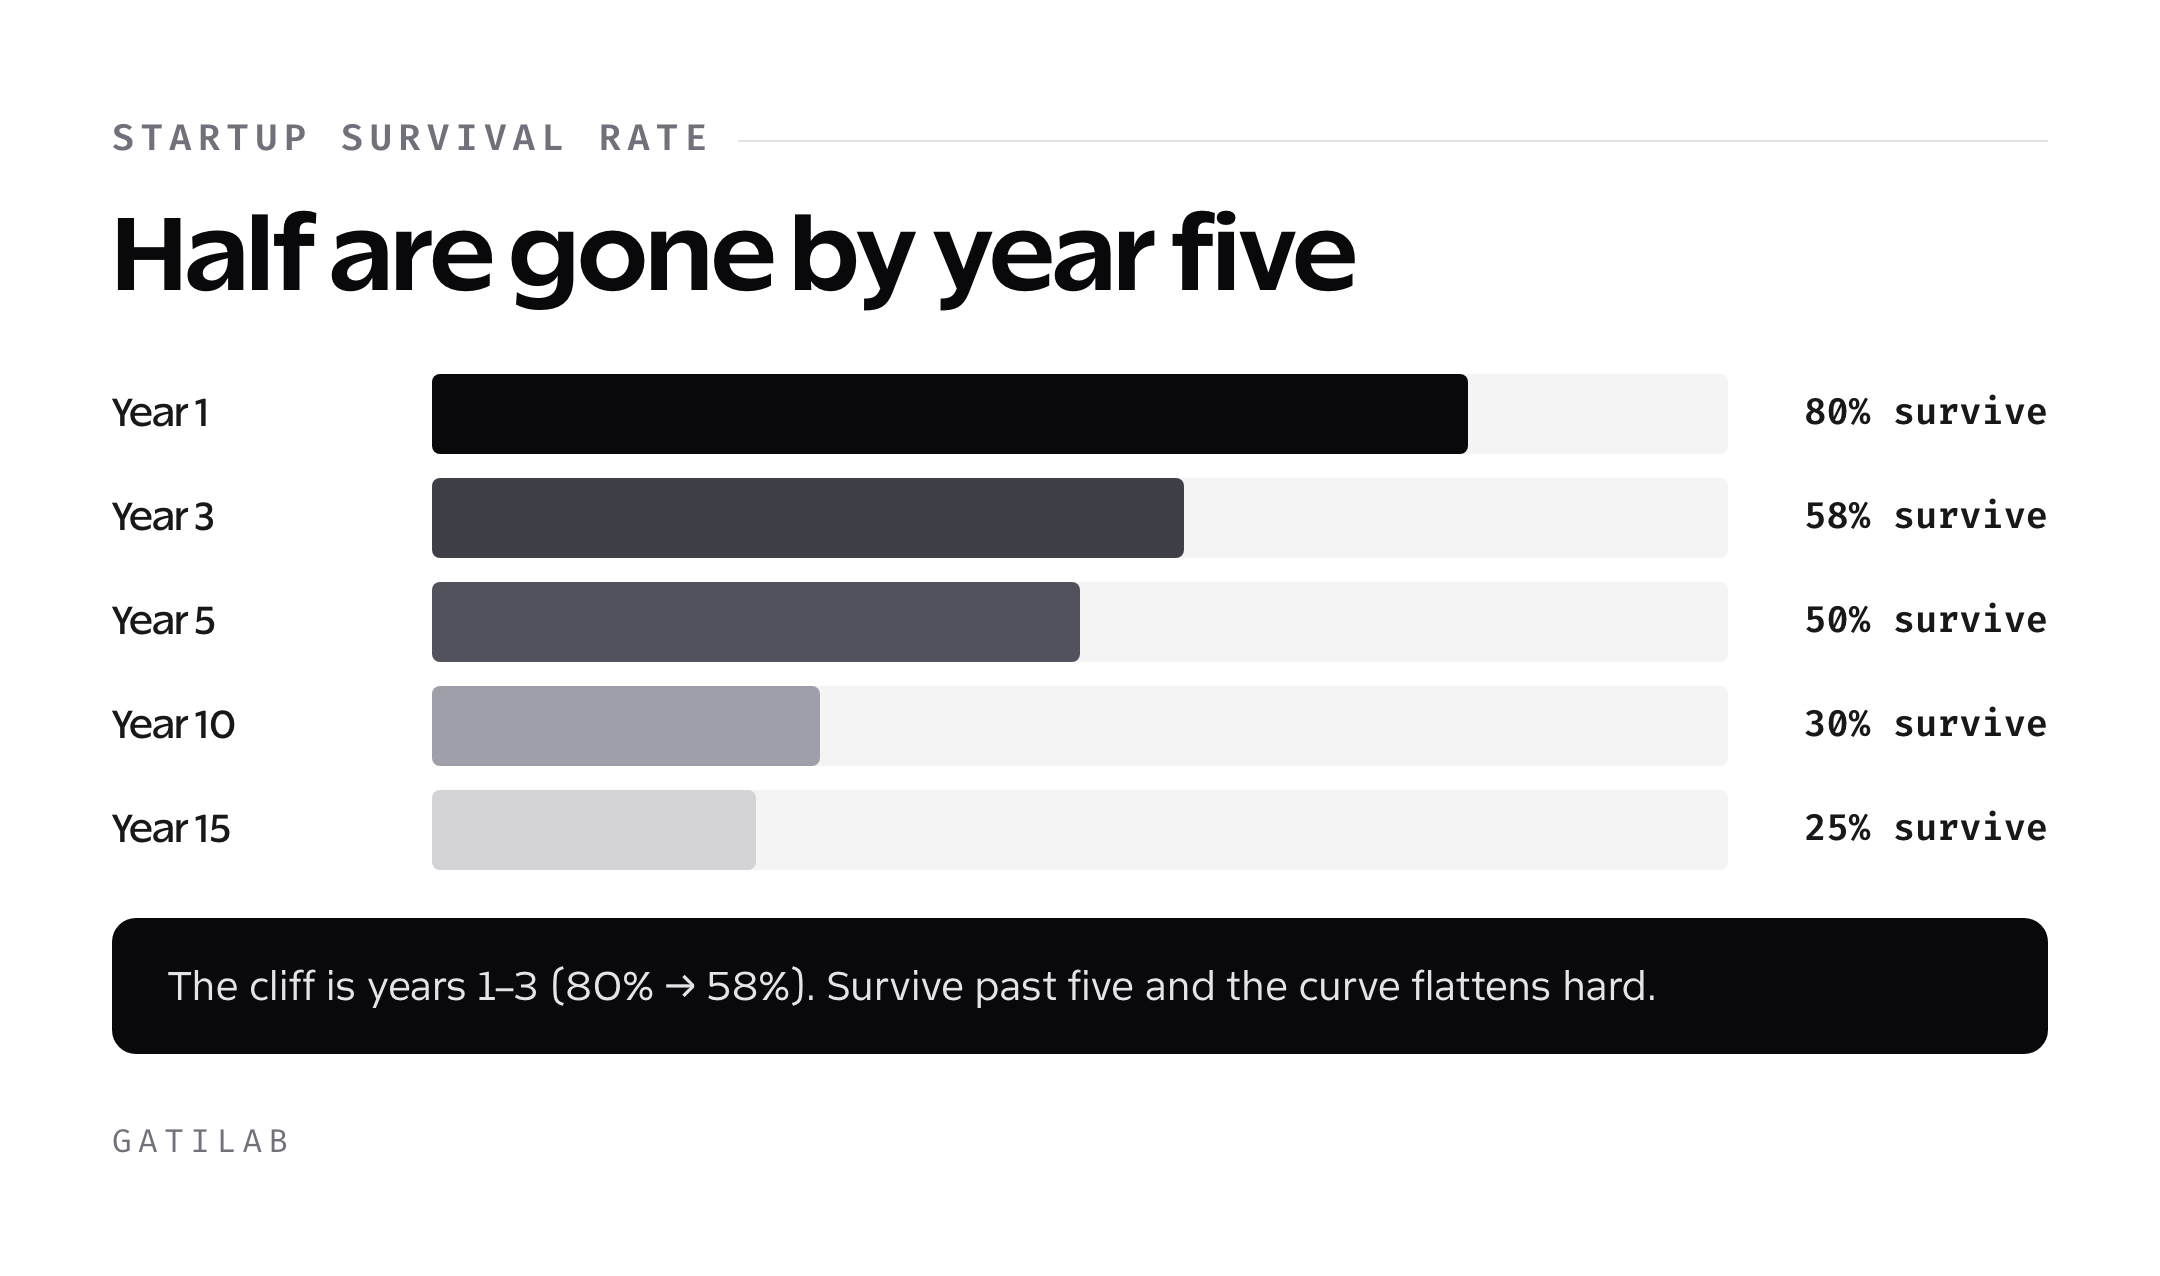
There is no defensible universal startup failure rate. In the United States, BLS tracks private-sector establishments by opening cohort. For establishments born in 2022, 1-year survival ranged from 74.4% to 78.6% across the 9 Census divisions.
That dataset measures establishments, not venture-backed startups, founders, apps, or product ideas. The distinction is the difference between a statistic and a slogan. BLS cohort table
- State the opening cohort and geography.
- Separate 1-year, 5-year, and longer survival windows.
- Do not infer a single closure reason from survival records.
- Keep venture-backed startup outcomes separate from all new establishments.
Entrepreneur Demographics
Demographic claims need a population boundary. GEM surveys adults and reports entrepreneurial activity; SBA profiles business ownership; Census and BLS report firms and establishments. Those sources should not be combined as if they count the same people.
For cross-country comparisons, use the same GEM indicator and year. For US ownership, use the SBA profile’s underlying Census datasets. Keep founder age, owner demographics, self-employment, and venture-funded founder data in separate tables.
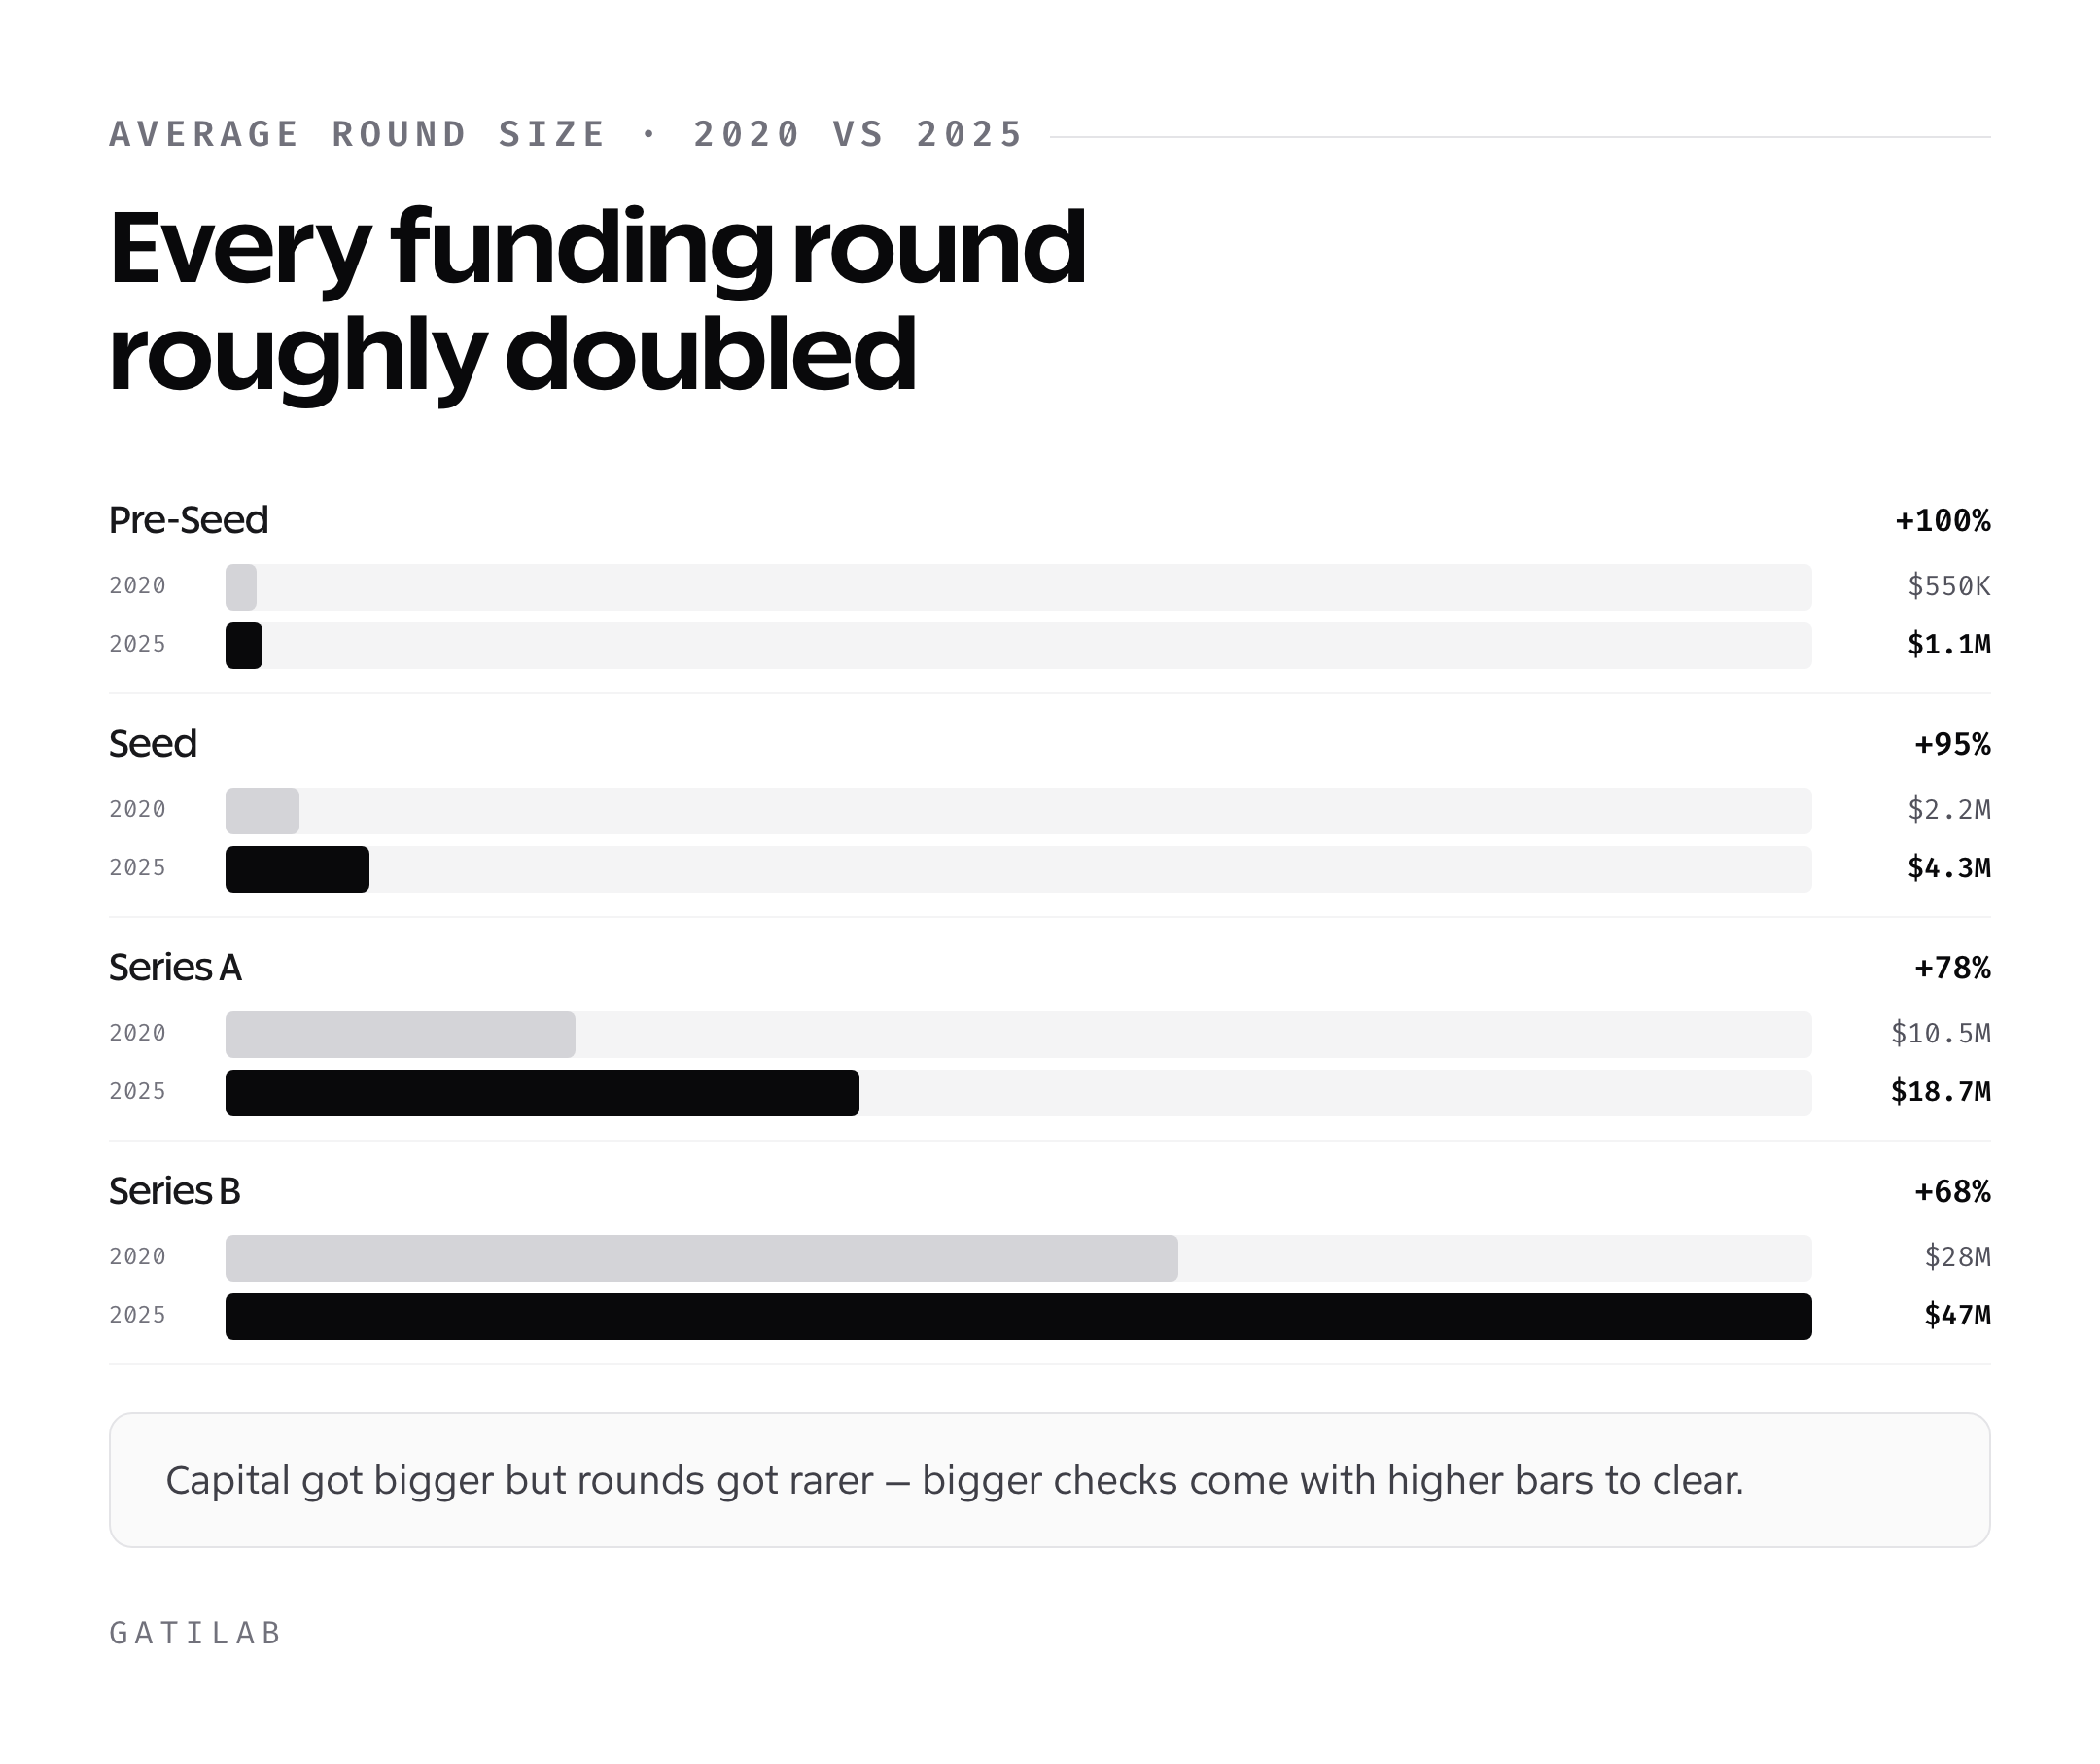
Entrepreneurship Funding Statistics
Funding data is not one market. Venture capital rounds, angel checks, crowdfunding, bank credit, personal savings, and revenue-financed businesses cover different populations.
| Funding dataset | Useful denominator | Common mistake |
|---|---|---|
| Venture capital | Deals, companies, stage, geography, and period | Treating venture-backed firms as all startups |
| Angel investment | Disclosed rounds and participating investors | Assuming undisclosed private checks are fully observed |
| Crowdfunding | Campaigns, platform, success definition, and launch year | Mixing pledged and collected amounts |
| Bootstrapping | Owner-funded or revenue-funded firms in a defined survey | Using absence from a deal database as proof of bootstrapping |
A funding statistic belongs here only when the provider publishes the sample, geography, time window, and definition of a deal. Otherwise it should remain a research lead, not a number in the article.
Digital Entrepreneurship Statistics
Online business is not a statistical category with one denominator. Ecommerce sellers, freelancers, creators, software companies, publishers, and remote service firms have different registration, revenue, and survival patterns.
Census Business Formation Statistics tracks applications and projected employer formations, but an application is not an operating online business. As of the January 2026 release, Census also changed high-propensity application definitions by excluding applications associated with internet sales from specified series, which makes careless trend comparisons especially risky.
Mistakes I’ve Made (and Seen Clients Make)
Statistics are useful. Honesty about failures is more useful. Here’s what I got wrong.
Underpricing without measuring delivery cost. A low quote can increase demand while reducing margin and attracting scope that the business cannot support. Track effective hourly contribution, revisions, collection time, and referral quality by service.
Depending on one acquisition channel. Search, social, referrals, partnerships, and email have different failure modes. Build a consented audience and measure how each channel contributes to qualified demand.
Buying tools before validating the job. Software does not create demand. Define the customer problem, minimum deliverable, evidence, and success metric before expanding the stack.
Treating bank balance as bookkeeping. Reconcile revenue, direct cost, operating expense, receivables, tax, debt, and cash on a fixed cadence. Small recurring costs become visible when every account has an owner and category.
What the Data Actually Tells Aspiring Entrepreneurs
The figures become useful only when the source population and the operating decision match.
Timing and Industry Selection
Online businesses have lower failure rates, lower startup costs, and higher profit margins than traditional businesses. If you’re starting fresh in 2026, digital-first is the obvious play. E-commerce, blogging, freelancing, and SaaS all have better risk-adjusted returns than opening a restaurant or retail store.
Age is on your side no matter when you start. The 45-year-old average founder age tells us experience matters more than youthful energy. If you’re 30, 40, or 50 and thinking it’s too late, the data says the opposite.
The Funding Myth
Do not treat venture funding as the default path. Compare the financing options available to the specific business, including revenue, owner capital, credit, grants, partners, and equity, with their control, repayment, and risk consequences.
Don’t let the lack of a funding round make you feel like you’re behind. You’re in the majority. And the bootstrapped majority often ends up wealthier than the funded minority.
Use Entrepreneurship Statistics Carefully
Population statistics cannot validate one business idea. Use them to define the market and risk boundary, then test a specific customer problem, offer, price, acquisition path, delivery cost, and retention signal.
Start small enough to learn without risking the business. After 18 years, that remains the practical rule: evidence from paying or committed customers beats a dramatic global headline.
Frequently Asked Questions
How many entrepreneurs are there worldwide?
There is no authoritative single global count because surveys, registrations, self-employment records, and firm datasets measure different populations. GEM reports comparable activity rates across participating economies instead.
What does GEM measure?
GEM’s Adult Population Survey measures intentions, nascent activity, new business ownership, established ownership, attitudes, and motivations. Its 2025/2026 global report covered more than 160,000 adults across 53 economies.
What percentage of new businesses survive the first year?
In the US BLS establishment data for the 2022 birth cohort, 1-year survival ranged from 74.4% to 78.6% across Census divisions. Do not apply that range to every country or to venture-backed startups.
Which country is best for entrepreneurship?
That depends on the indicator. GEM’s 2025/2026 National Entrepreneurship Context Index ranked the UAE first, but startup activity, established ownership, finance, education, and market access are separate measures.
Are business applications a count of startups?
No. Census applications are administrative signals. The Business Formation Statistics program separately models formations likely to hire employees.
Tell Google you want more of this.
Add Gatilab as a preferred sourceOne tap, and this site shows up more often in your own Top Stories, AI Overviews and AI Mode. Remove it any time.