
Web Hosting Statistics for 2026: Market Size, Pricing, and Performance Data
There are about 1.49 billion websites and roughly 217 million of them are active, and no single company hosts more than 5.3% of them. Those are the 2 web hosting statistics that reframe the rest: the web is enormous, mostly dormant, and more fragmented at the hosting layer than any market-share chart suggests.
Most hosting statistics pages fall into one of 2 traps. One quotes a market size to the second decimal from a firm that never published its method, then pairs it with a growth rate another firm contradicts by a factor of 2. The other recycles a 2014 downtime figure and a 2006 page-speed study as if nothing has been measured since. The picture from primary sources is more useful than either: the industry is worth somewhere between $150 and $185 billion depending on where you draw the cloud line, half the mobile web still fails Google’s speed bar, and the headline price on a shared plan is 2 to 4.5 times lower than what you pay at renewal.
The web got bigger. The hosting business got more concentrated at the top and more fragmented everywhere else.
Every figure below names who measured it and when. Hosting is one of the few fields where several of the best sources update monthly, so a number without a month attached is already suspect.
Key Web Hosting Statistics
The figures that carry the rest of this page.
- 1,494,915,628 websites on 305 million domains and 14.8 million web-facing computers, about 217 million of them active (Netcraft, July 2026)
- 401.6 million registered domain names, up 8.1% in a year; .com holds 166.6 million (Verisign, second quarter 2026)
- 5.3% is the largest share of websites any host holds; Shopify, Hostinger, and Amazon lead, and the top 20 hosts together cover about 48% (W3Techs, August 2026)
- $143.4 billion of cloud infrastructure revenue in a single quarter, up 43%, with Amazon at 28%, Microsoft 20%, and Google 15% (Synergy Research, second quarter 2026)
- 48% of mobile origins pass all 3 Core Web Vitals; only 44% have a good time to first byte (HTTP Archive Web Almanac, July 2025 data)
- 90.0% of websites default to HTTPS, 40.3% support HTTP/3, and Let’s Encrypt secures 64.4% of all sites (W3Techs, August 2026)
- 47.1 million DDoS attacks mitigated by Cloudflare in 2025, up 121%, with a record 31.4 terabits per second
- 2.0 to 4.5 times is the gap between a shared host’s headline price and its renewal price, read from 8 hosts’ own pages in August 2026
How Big the Web Is
The Netcraft Web Server Survey has counted hostnames every month since 1995, and its July 2026 edition is the cleanest measure of scale available.
- 1,494,915,628 sites, up 5.5 million in the month and 21.1 million the month before
- 305,348,459 unique domains and 14,772,048 web-facing computers
- About 217 million active sites, derived from Cloudflare’s 50.8 million active sites being 23.46% of the active base. Roughly 85% of the web is parked, duplicate, or dormant
- 401.6 million domain registrations across all top-level domains at the end of June 2026, up 29.9 million in a year; .com at 166.6 million and .net at 12.5 million (Verisign)
- 6.0 billion people online, 74% of the world, with 240 million added in 2025 (International Telecommunication Union)
- Global internet traffic grew 19% in 2025, after 17% in 2024 (Cloudflare Radar)
The gap between 1.49 billion sites and 217 million active ones is the number to carry into every other statistic on this page. When a host says it powers millions of websites, ask how many of them have served a page this month. The answer is usually about 1 in 7.
Web Hosting Market Size
Four research firms publish a “web hosting services market” figure for 2026. They agree on the size within a few billion and disagree on the growth rate by a factor of 2, which tells you the size is a shared assumption and the growth rate is a guess.
| Research firm | 2026 estimate | Growth rate | Endpoint |
|---|---|---|---|
| Fortune Business Insights | $178.76 billion | 17.8% a year | $661 billion by 2034 |
| Mordor Intelligence | $182.28 billion | 10.5% a year | $300 billion by 2031 |
| Grand View Research | not stated | 20.2% a year | $321 billion by 2030 |
| Statista Market Insights | paywalled | 16.6% a year | $356 billion by 2029 |
Now set those against a number that is counted rather than modelled. Synergy Research tallies the actual reported revenue of named cloud vendors, and its figure for cloud infrastructure services alone was $143.4 billion in the second quarter of 2026, up 43%, or about $500 billion over the trailing 12 months. One quarter of cloud infrastructure is bigger than most firms’ estimate for a full year of “web hosting.”
The definitions do not nest. Shared, VPS, and managed hosting for websites is a $150 to $185 billion business in 2026. Add hyperscale cloud and it is several times that. Any article that gives you one number without saying which market it means has not read the footnote.
Same industry, 3 different sizes, depending on where you draw the line.
Who Hosts the Web
No hosting company holds more than 5.3% of websites, and the top 3 are not traditional hosts at all. W3Techs surveys the 10 million most-visited sites, and its August 2026 ranking shows how far the market has fragmented.
| Provider | Share of websites | Type |
|---|---|---|
| Shopify | 5.3% | Commerce platform |
| Hostinger | 5.1% | Shared and cloud host |
| Amazon | 4.5% | Hyperscale cloud |
| Wix | 4.2% | Site builder |
| IONOS (United Internet) | 2.6% | Shared host |
| GoDaddy | 2.5% | Shared host and registrar |
| Squarespace | 2.5% | Site builder |
| Newfold (Bluehost, HostGator) | 2.4% | Shared host |
| OVH | 2.4% | Cloud and dedicated |
| Hetzner | 2.2% | Cloud and dedicated |
| SiteGround | 2.0% | Shared and cloud host |
| Vercel | 1.9% | Edge and serverless |
| WP Engine | 1.3% | Managed WordPress |
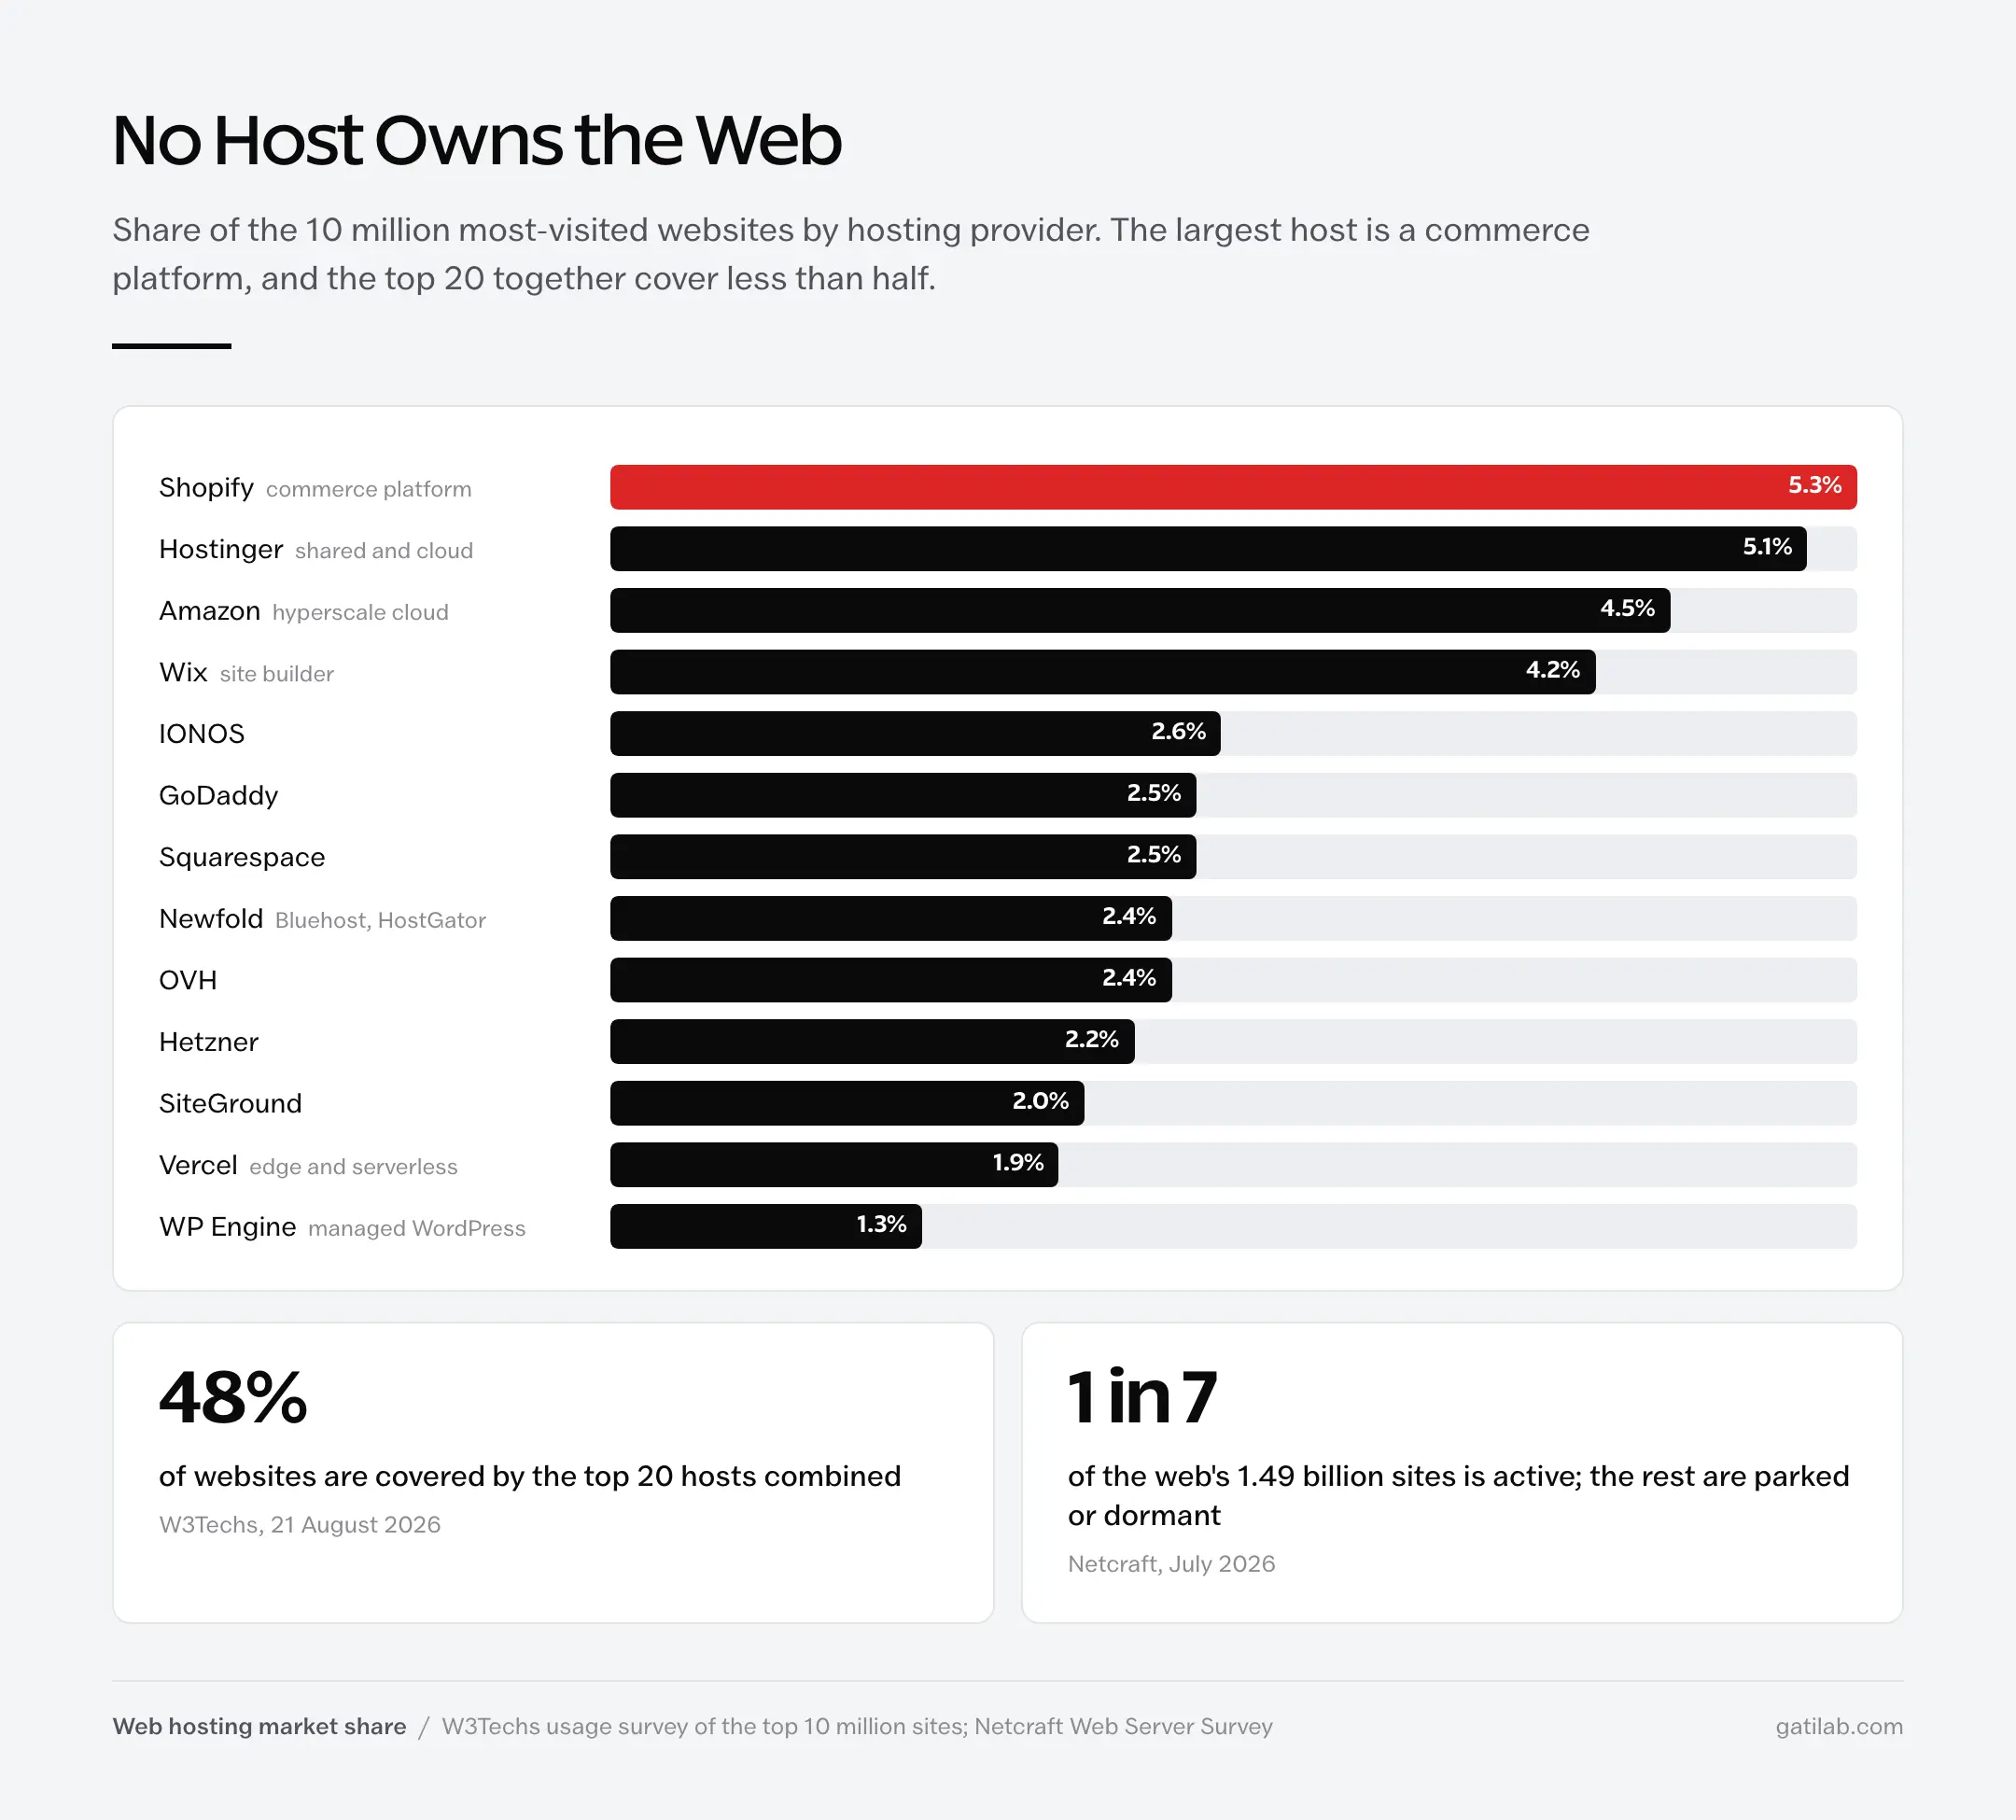
Three things in that table would have looked wrong 5 years ago. A commerce platform is the largest host of websites. Hostinger, a company with about 900 employees, is within a fifth of a point of it. And Vercel, a serverless platform that barely existed as a host in 2020, now serves more sites than Google or DigitalOcean.
The company-disclosed numbers fill in what share can’t show.
- GoDaddy: 20.5 million customers, about 82 million domains under management, $5.0 billion in 2025 revenue, and an average of $250 per customer a year (SEC filings, July 2026)
- Hostinger: “over 5 million users” per its own page, up from 3 million in 2024 and 4 million in 2025
- Newfold Digital: nearly 7 million customers, with Bluehost at over 5 million; nearly 1 million Bluehost customers moved to Oracle Cloud with 4 to 5 times better median response times (company newsroom, November 2025)
- Kinsta: 230,000+ customers in 128 countries, with 60%+ customer growth in a year (company blog, March 2026)
- WP Engine: more than 1.5 million users and customers; its claim that 8% of people online visit a site it hosts each day
- Cloudflare: $696.1 million in quarterly revenue, up 36%, guiding to about $2.87 billion for 2026, with more than 3 million developers on its platform
GoDaddy’s $250 per customer per year is the most useful number in that list, because it is the only one derived from audited revenue divided by an audited customer count. Most hosts publish a customer figure or a revenue figure, never both.
Web Servers, CMS, and Protocols
Two surveys measure what software runs the web, and they disagree on Cloudflare by 13 points for a reason worth understanding before quoting either.
- W3Techs (top 10 million sites, August 2026): nginx 31.4%, Cloudflare 29.6%, Apache 22.6%, LiteSpeed 14.9%, Node.js 7.0%
- Netcraft, all 1.49 billion hostnames (July 2026): nginx 20.4%, Cloudflare 16.7%, Apache 11.5%, OpenResty 8.0%
- Netcraft, top million busiest sites: Cloudflare 28.3%, nginx 20.0%, Apache 15.6%, LiteSpeed 3.9%
- Among web-facing computers rather than sites: nginx 43.9%, Apache 18.8%, Microsoft 5.7%
W3Techs weights toward sites people visit; Netcraft counts every hostname including parked-domain farms, which is why OpenResty swung from 5% to 14% of domains in a single month. Cloudflare sits in front of nearly 30% of sites that matter and 17% of sites that exist. Say which one you are quoting.
Apache’s fall is the quiet story. It ran over half the web in 2010. It now runs 22.6% of the top 10 million and 15.6% of the top million, behind a CDN that did not exist as a server category a decade ago.
CMS and CDN Share
- WordPress runs 40.7% of all websites and 58.9% of sites with a known CMS, down from the 43% peak; 30.9% of sites use no tracked CMS (W3Techs, August 2026)
- Shopify 5.3%, Wix 4.2%, Squarespace 2.4%, Joomla 1.2%, Webflow 0.8%, Drupal 0.7%
- 29.3% of websites sit behind a reverse proxy or CDN; Cloudflare alone fronts 24.7% of all sites, 84.4% of the proxied ones
- Among HTML pages served through a CDN: Cloudflare 58%, Google 21%, CloudFront 7%, Fastly 5% (Web Almanac 2025)
- HTTPS is the default on 90.0% of websites; HTTP/3 is supported by 40.3%, HTTP/2 by 34.7%, IPv6 by 31.4%
- Let’s Encrypt secures 64.4% of all sites and served 762 million websites at the end of 2025, up 55% in a year; 0.6% of sites serve an expired certificate
- Chrome 154, due October 2026, will warn before loading any public HTTP site by default
HTTP/3 passing HTTP/2 in site count is the number that tells you where the protocol gap is. On CDN-served pages, 29% of requests use HTTP/3. From origin servers, roughly 0% do. If your host has not put you behind a CDN, you are serving the newest protocol to nobody. The fastest hosting providers are largely the ones that made that decision for you.
Hosting Performance Statistics
Google measures page experience with 3 Core Web Vitals, and about half the mobile web fails at least one of them. The HTTP Archive Web Almanac 2025, built on Chrome User Experience Report data from July 2025, gives the pass rates.
| Metric | Good threshold | Mobile origins passing | Desktop origins passing |
|---|---|---|---|
| All 3 Core Web Vitals | 48% | 56% | |
| Largest Contentful Paint | 2.5 seconds or less | 62% | 74% |
| Interaction to Next Paint | 200 milliseconds or less | 77% | 97% |
| Cumulative Layout Shift | 0.1 or less | 81% | 72% |
| Time to First Byte | 0.8 seconds or less | 44% | 55% |
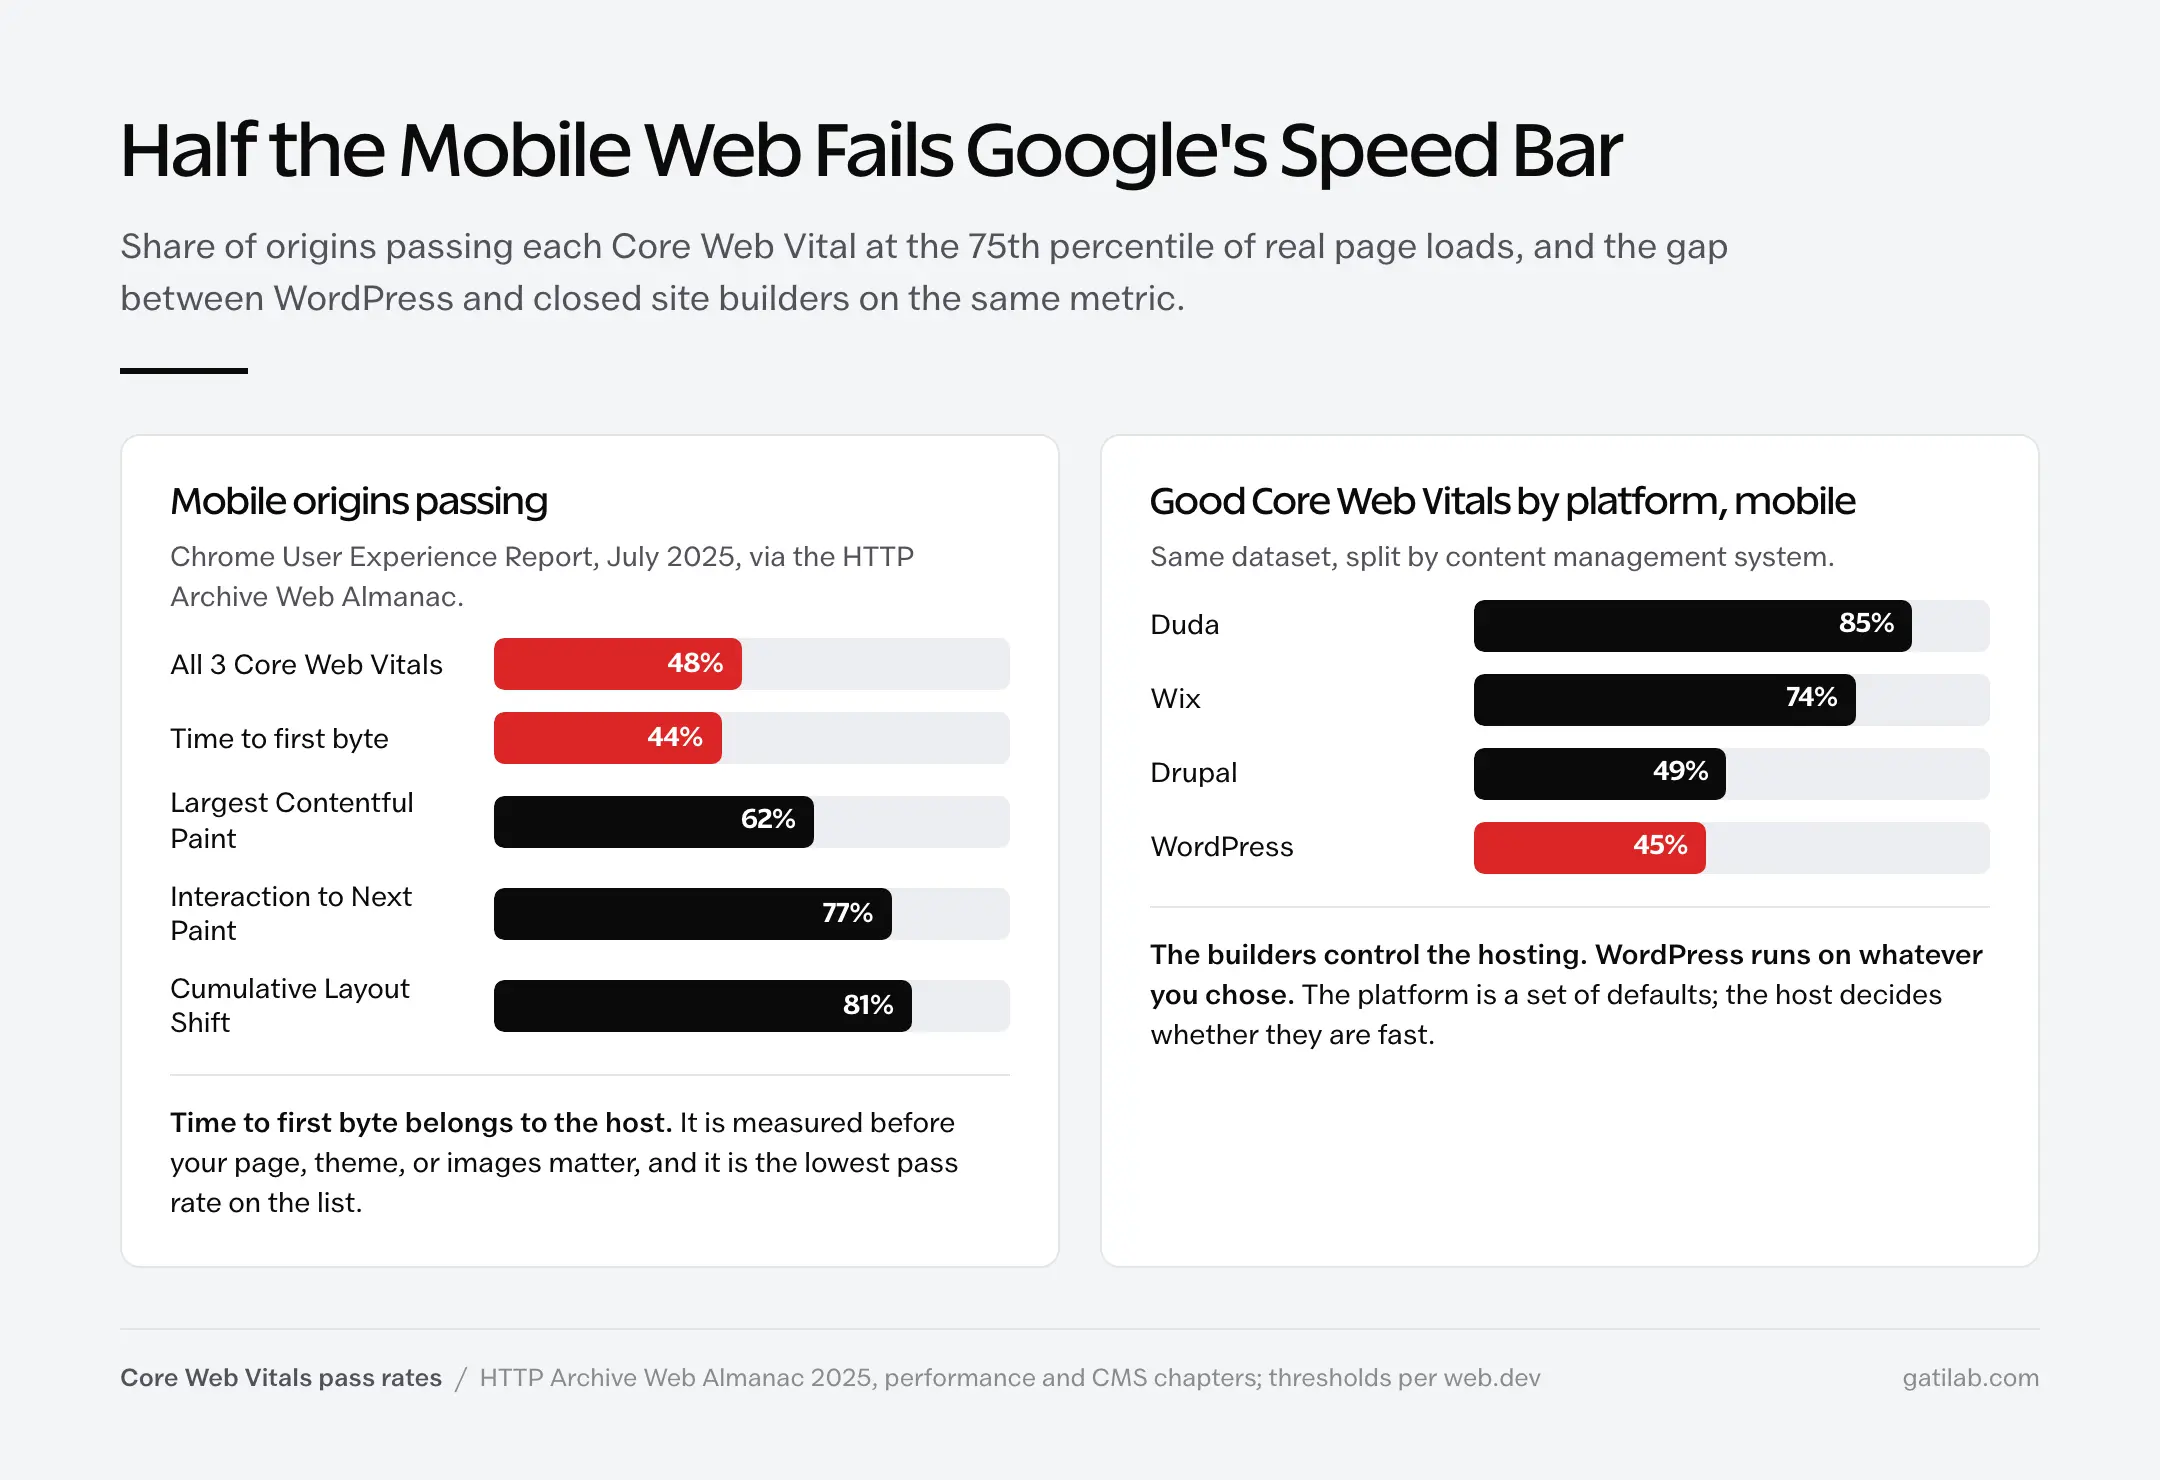
Time to first byte is the metric that belongs to your host. It measures how long the server takes to start responding, before a single byte of your page, theme, or images matters. Only 44% of mobile origins get it under 0.8 seconds, and that figure improved just 2 points in a year. It is the clearest evidence that hosting, not design, is the bottleneck on most slow sites.
Largest Contentful Paint is the mobile failure point, at 62%. Layout shift is mostly solved. Interaction responsiveness is nearly solved on desktop and has a real gap on mobile.
The split by platform is sharper than the average.
- Good Core Web Vitals on mobile by CMS: Duda 85%, Wix 74%, Drupal about 49%, WordPress 45% (Web Almanac 2025)
- Good Largest Contentful Paint on mobile: Duda 94%, Wix 81%, WordPress 53%
- Good layout stability: Wix 95%, Squarespace 89%, WordPress 84%
WordPress passes on 45% of mobile origins and the closed builders pass on 74% to 85%. That is not because WordPress is slower. It is because Wix and Duda control the hosting, the CDN, and the theme, and WordPress sites run on whatever the owner chose, which is often a $3 shared plan with 40 plugins. The platform is a set of defaults. The host decides whether those defaults are fast.
No primary source publishes Core Web Vitals by hosting company. Any table claiming to show “pass rates by host” was assembled by a vendor or a roundup. The closest measured evidence is the CDN-versus-origin gap above and the CMS split, and both point the same way: the infrastructure layer is where the time goes.
Uptime and Downtime Statistics
Outages are getting rarer per site and more expensive when they happen. The Uptime Institute’s 2026 Annual Outage Analysis, the longest-running survey of data center operators, has the measured picture.
- Per-site outage frequency fell for the fifth consecutive year, though the improvement has slowed
- 57% of operators say their last major outage cost more than $100,000; 1 in 5 say more than $1 million, the second year running at that level
- Power failures remain the leading cause of serious outages; fiber and connectivity failures are rising and more likely to cause long disruptions
- Third-party providers, meaning cloud, telecom, and colocation, account for about two-thirds of publicly reported outages over 9 years of tracking
The arithmetic behind uptime guarantees is worth having to hand, because “99.9%” sounds close to perfect and is not.
- 99.9% uptime allows 8 hours 45 minutes of downtime a year
- 99.99% allows 52 minutes
- 99.999% allows 5 minutes
A shared host advertising 99.9% is promising you a full working day offline each year and calling it a guarantee. Read the credit terms: most refund a fraction of a month’s fee, not the revenue you lost.
The “$5,600 per minute” downtime cost that circulates is from a Gartner analyst blog post dated 16 July 2014, was an enterprise average, and has nothing to do with a website on shared hosting. It is 12 years old. What buyers actually report is smaller and more specific: in a Liquid Web survey of 506 business owners and developers in March 2025, respondents spent an average of $418 a month resolving hosting problems, 72% were only somewhat or slightly satisfied with their host, and 10% had never switched.
Hosting Security Statistics
Attack volume roughly doubled in 2025, and the defenses most hosts provide caught a small fraction of it.
- Cloudflare mitigated 47.1 million DDoS attacks in 2025, up 121%, about 5,376 an hour, including a record 31.4 terabits per second attack that lasted 35 seconds
- In the first half of 2026: 23.2 million network-layer attacks, 29.64 trillion malicious HTTP requests, and 935 attacks over 1 terabit per second, up 519% quarter on quarter
- Human visitors were 47% of HTML requests on Cloudflare’s network by December 2025; non-AI bots were 44% and AI crawlers 4.2%
Fewer than half of requests to the average site now come from a person. When a host advertises bandwidth, more than half of what you are paying to serve is bots.
For WordPress specifically, Patchstack’s 2026 report is the current primary source, and its most important finding is about hosting.
- 11,334 new WordPress-ecosystem vulnerabilities in 2025, up 42%; 91% in plugins, 9% in themes, 6 in core, all low risk
- 46% were still unpatched when publicly disclosed
- Median time from disclosure to mass exploitation: 5 hours; 45% exploited within 24 hours, 70% within a week
- Hosting-level and traditional defenses blocked only 12% of WordPress-specific attack payloads in Patchstack’s tests, with wide variance between hosts
- Sucuri’s last full report found 1.66% of 70.8 million scanned sites infected, with malware and redirects in 74.7% of infections and SEO spam in 38.4% (2024 data)
Five hours from disclosure to mass exploitation, and the host’s firewall stops 1 attack in 8. Almost half of vulnerabilities ship unpatched. The defensive layer that matters is the one that updates plugins within hours, and most hosting plans do not include it. If yours does not, the managed WordPress hosts that do are paying for that window, which is most of what the price difference buys.
Cloud Infrastructure Statistics
Cloud infrastructure grew 43% in a single quarter in 2026, the fastest rate in 8 years, and almost all of it is AI capacity. Synergy Research’s second-quarter tally and the hyperscalers’ own filings tell the same story.
- Market share: Amazon 28%, Microsoft 20%, Google 15%, the 3 together 63% of the market and 67% of public cloud
- AWS: $42.2 billion in quarterly sales, up 37%, its fastest growth in 18 quarters, with $16.6 billion in operating income
- Microsoft: Azure and other cloud services up 43%; Azure passed $100 billion in annual revenue for fiscal 2026
- Google Cloud: $24.8 billion, up 82%, with operating income tripling to $8.8 billion; Alphabet’s capital spending hit $44.9 billion in the quarter
- Combined 2026 capital spending guidance from Amazon, Alphabet, Microsoft, and Meta: $725 to $785 billion, about 77% above 2025
- 9 “neocloud” providers, including CoreWeave, Oracle, and Nebius, now sit in the top 40 by revenue
- 89% of organizations use more than one cloud provider; 76% of large enterprises spend over $5 million a month (Flexera 2026)
Three quarters of a trillion dollars of capital spending in one year, from 4 companies. That money is building GPU clusters, not web servers, and it is why the “hosting market” numbers above and the cloud numbers here describe 2 different industries that happen to share a word.
It also explains the price rises at the bottom of the market. Hetzner raised its entry cloud server price 4 times in 2026, from 3.99 to 5.49 euros, citing memory prices up 93 to 98% in a quarter. When hyperscalers buy all the DRAM, the $4 VPS gets more expensive.
Data Center Energy
Data centers used about 1.5% of the world’s electricity in 2024 and are on track for 3% by 2030, according to the International Energy Agency.
- 415 terawatt-hours in 2024, rising to 485 TWh in 2025, up 17%, with AI-focused facilities up 50%
- About 950 TWh by 2030 in the base case, and around 1,200 TWh by 2035, with the US and China accounting for nearly 80% of growth
- US data centers used 176 TWh in 2023, 4.4% of national electricity, and are projected at 6.7% to 12% by 2028 (Lawrence Berkeley National Laboratory for the Department of Energy)
- The Green Web Foundation lists 350 verified green hosting providers in 40 countries
No primary dataset measures carbon intensity per hosting provider. Hosts publish their own efficiency ratios and renewable-matching claims, which are not comparable. The Green Web Foundation directory is the only independent check, and it verifies a claim of renewable supply, not a measurement of emissions.
Web Hosting Pricing Statistics
The price on a shared host’s homepage is not the price you pay. Read from 8 providers’ own pricing pages on 21 August 2026, the headline rate requires 1 to 4 years paid upfront and renews at 2 to 4.5 times the number you saw.
| Plan | Headline price | Term to get it | Renewal | Multiple |
|---|---|---|---|---|
| Hostinger Premium | $2.99/mo | 48 months, $143.52 upfront | $10.99/mo | 3.7x |
| Hostinger Unlimited | $3.99/mo | 48 months, $191.52 upfront | $16.99/mo | 4.3x |
| Bluehost Starter | $3.99/mo | 36 months | $9.99/mo | 2.5x |
| Bluehost Business | $6.99/mo | 36 months | $13.99/mo | 2.0x |
| SiteGround StartUp | $3.99/mo | 12 months | $17.99/mo | 4.5x |
| SiteGround GrowBig | $6.69/mo | 12 months | $29.99/mo | 4.5x |
| Cloudways, 2 GB DigitalOcean | $11/mo | none, hourly | $11/mo | flat |
| DigitalOcean Basic, 1 GB | $6/mo | none, per second | $6/mo | flat |
| Kinsta Single | $35/mo | none | $35/mo | flat |
| WP Engine Startup | $30/mo | 12 months | not disclosed | unknown |
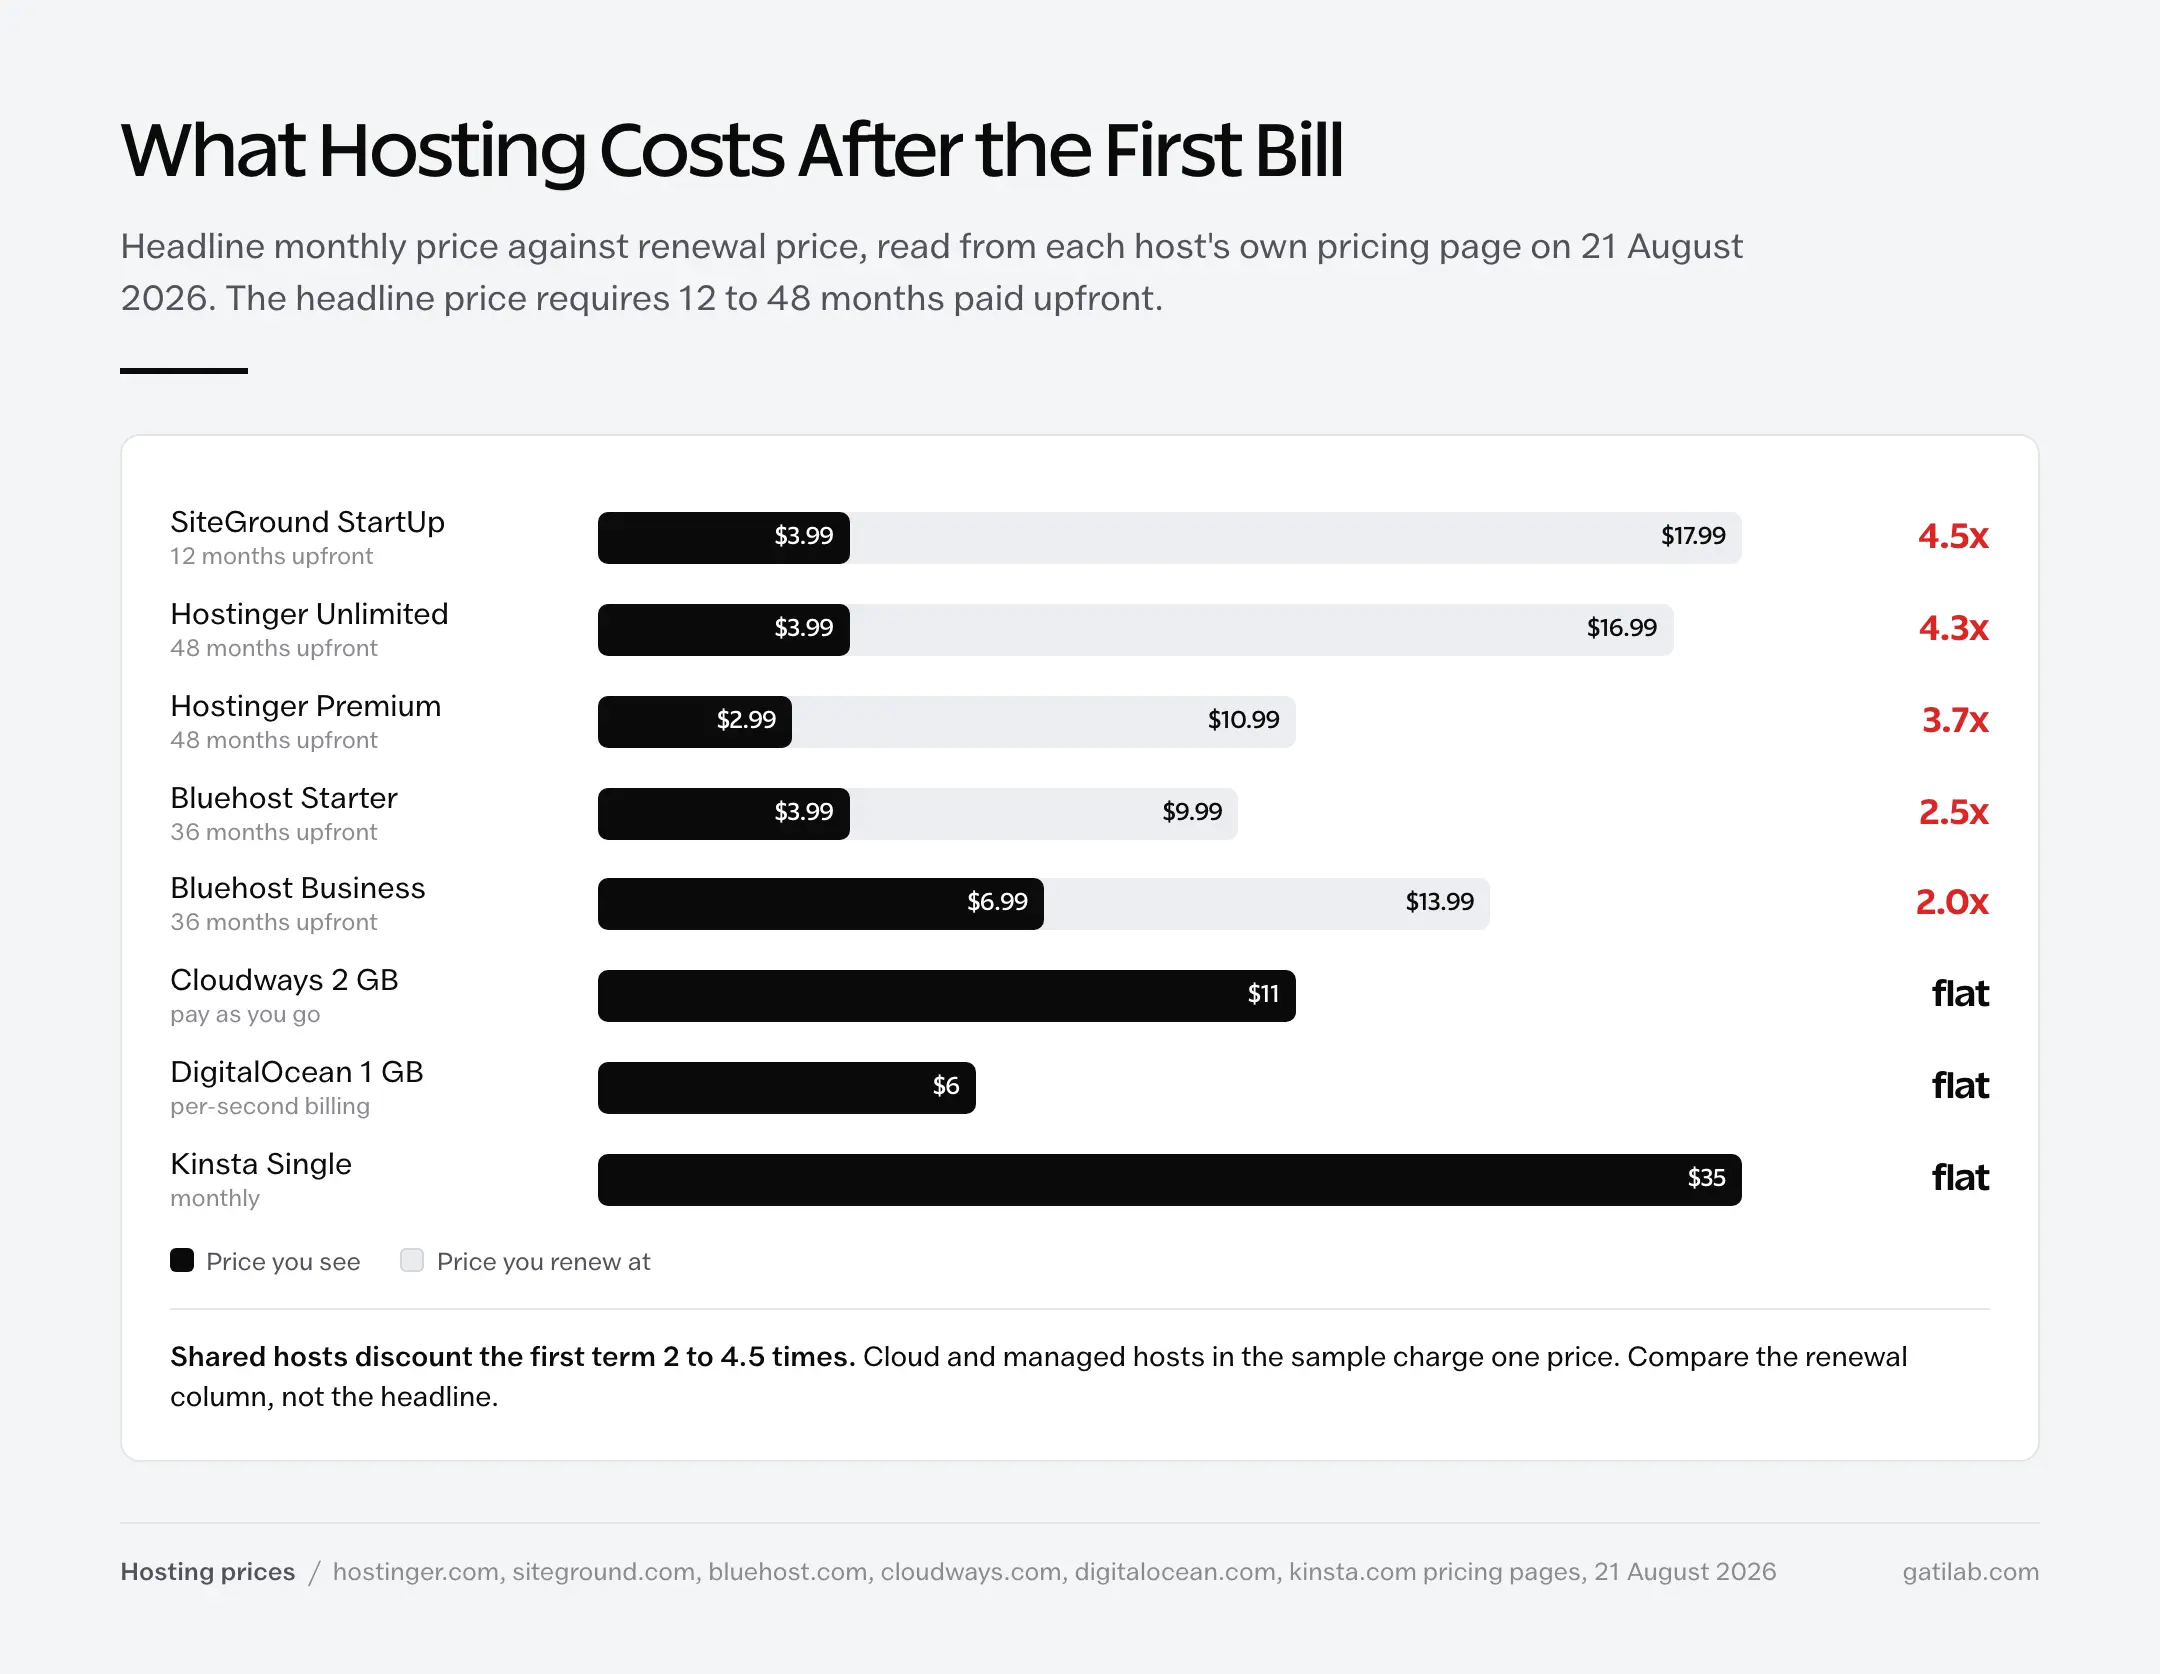
Over 4 years, Hostinger Premium costs $143.52 for the first term and then $527.52 for the second at the renewal rate. The “$2.99 a month” plan is a $671 plan. That is still cheaper than most alternatives, but it is not the number on the banner, and the comparison you should be making is renewal against renewal.
Cloud and managed hosts in the sample do the opposite: one price, no term, no step. Cloudways at $11, DigitalOcean at $6, and Kinsta at $35 cost more on day 1 and the same on day 1,461. Whether that is a better deal depends entirely on how long you plan to keep the site.
Prices at the bottom of the market moved up in 2026 for a reason unrelated to hosting. Hetzner raised its entry cloud server from 3.99 to 5.49 euros across 4 increases between February and June, citing memory prices up 93 to 98% in a single quarter as hyperscalers bought the supply. The cheapest VPS on the market got 38% more expensive because of AI data centers.
What buyers expect does not match any of this. In a November 2025 survey of 1,000 US adults, 8 in 10 named cost as the most important factor in choosing a host, about 6 in 10 expected to pay no more than $25 a month, 72% had only a vague idea what hosting is, and 24% did not know the term. The renewal multiple exists because the market is built for people who will not read the second line. If you are comparing plans, the hosting selection guide works through the line items that matter after the first bill.
Web Hosting in India
India is building data center capacity faster than any market outside the US and China, and it leads the world on one protocol statistic.
- Data center capacity passed 1,700 megawatts at the end of 2025, with 440 MW added in the year, up 160%, and about 500 MW more expected in 2026; Mumbai holds over half of operational inventory (CBRE India)
- Cumulative data center investment commitments reached $126 billion at the end of 2025 and are expected to pass $180 billion in 2026
- Public cloud spending in India forecast at $17.5 billion in 2026, up 28.1% (Gartner)
- About 4 million .in domains under management, with .in among the 10 largest country domains worldwide (NIXI; Verisign)
- More than two-thirds of dual-stack requests from India use IPv6, against 29% globally (Cloudflare Radar)
The IPv6 figure is the surprising one. India skipped a generation of network infrastructure and went mobile-first on modern protocols, so an Indian visitor is more than twice as likely as a global one to reach your site over IPv6. If your host does not support it, 31.4% of websites do not, you are adding a translation step for most of the country.
Managed WordPress Hosting
Managed WordPress hosting is a small share of websites and a disproportionate share of the conversation, partly because of a lawsuit.
- WP Engine Group hosts 1.3% of all websites (W3Techs) and reports more than 1.5 million sites and 185,000 customers
- Kinsta reports 230,000+ customers and 60% growth in a year but does not appear in W3Techs’ top 20
- Pressable, owned by Automattic, discloses no customer or site count
- WP Engine’s lawsuit against Automattic survived dismissal on most claims; a December 2024 injunction restored its access to WordPress.org after a block that left 200,000+ sites unable to update; discovery closed in May 2026 and trial is expected late 2026 or early 2027, with no settlement
No public dataset shows the dispute moving WP Engine’s share. It held 1.3% of websites in August 2026 and reports growth, not loss. Whatever the legal outcome, the commercial effect so far is not measurable from outside.
Web Hosting Statistics That Are Not True
Hosting roundups recycle a small set of numbers that are either untraceable or decades old. These are the ones you will meet most often.
There are 330,000 web hosting companies. No census of hosting companies exists anywhere. The figure has circulated since about 2021 with no origin.
30% of websites change hosts every year. Not in the Liquid Web study it is usually attributed to. Traces only to a defunct roundup site.
Downtime costs $5,600 a minute. A Gartner analyst’s blog post from 16 July 2014, describing an enterprise average.
47% of users expect a page to load in 2 seconds, and each second costs 11% of page views. Akamai, 2006, and Aberdeen Group, 2008. Twenty years old, from the dial-up to 3G transition.
Pages in positions 1 to 3 have a median time to first byte of 180 milliseconds versus 420 for the rest. Attributed to DebugBear, which published no such study. The original citation is an unnamed “analysis of 10 million results.”
92% of enterprises are multi-cloud, per Gartner. Gartner has no such figure. Flexera’s 2026 survey says 89%, and Flexera is the source.
The pattern is the same each time. A number gets published once with a date and a method, gets quoted without them, then gets quoted from the quote. Hosting is a field where the best sources update monthly, so a figure that arrives without a month attached is already a warning.
The Limits of This Data
Hosting has better primary data than most industries, and it still has edges worth knowing.
- Share surveys measure different universes. W3Techs counts the top 10 million sites; Netcraft counts every hostname. Cloudflare is 29.6% in one and 16.7% in the other, and both are right
- Market sizes are models. Four firms, a 2 times spread in growth rates, no published methods. Only Synergy’s cloud tally is counted from filings
- No one publishes performance by host. Core Web Vitals are available by CMS and by CDN-versus-origin, never by hosting company. Any such table is a vendor’s
- Company customer counts are self-reported and undated. “Over 5 million users” on an about page could be 2 years old
- Prices move monthly. Every price above was read on 21 August 2026. Hetzner changed its 4 times in 6 months
None of that makes the picture unusable. The direction of each trend is far more trustworthy than any single decimal, and a hosting statistic quoted to 2 decimal places without a month attached was never read off a source.
Frequently Asked Questions
How many websites are there?
Netcraft’s July 2026 Web Server Survey counted 1,494,915,628 websites across 305 million domains and 14.8 million web-facing computers. Only about 217 million are active; the rest are parked, duplicate, or dormant. Verisign counted 401.6 million registered domain names at the end of June 2026, up 8.1% in a year, with .com at 166.6 million.
How big is the web hosting market?
Between $150 billion and $185 billion in 2026 for website hosting, depending on the research firm: Fortune Business Insights says $178.76 billion, Mordor Intelligence $182.28 billion. Both are modelled estimates and they disagree on growth by a factor of 2, at 17.8% versus 10.5% a year. Cloud infrastructure is counted separately and larger: Synergy Research tallied $143.4 billion in the second quarter of 2026 alone.
Which company hosts the most websites?
Shopify, at 5.3% of the 10 million most-visited websites, followed by Hostinger at 5.1%, Amazon at 4.5%, and Wix at 4.2%, according to W3Techs in August 2026. No host exceeds 5.3% and the top 20 together cover about 48%. By disclosed customers, GoDaddy leads with 20.5 million and about 82 million domains under management.
What percentage of websites use WordPress?
40.7% of all websites and 58.9% of sites with a detectable content management system, per W3Techs in August 2026, down from a 43% peak. Shopify runs 5.3%, Wix 4.2%, and Squarespace 2.4%. About 30.9% of websites use no tracked CMS at all.
What is a good Core Web Vitals pass rate?
Only 48% of mobile origins and 56% of desktop origins pass all 3 Core Web Vitals, according to Chrome User Experience Report data from July 2025. The thresholds are Largest Contentful Paint at or under 2.5 seconds, Interaction to Next Paint at or under 200 milliseconds, and Cumulative Layout Shift at or under 0.1. Only 44% of mobile origins have a good time to first byte, the metric most directly controlled by the host.
How much does web hosting cost?
Shared hosting headline prices run $2.99 to $6.99 a month in August 2026 but require 12 to 48 months paid upfront, and renewal prices are 2 to 4.5 times higher: Hostinger Premium renews at $10.99 from $2.99, SiteGround StartUp at $17.99 from $3.99, Bluehost Starter at $9.99 from $3.99. Cloud hosts like DigitalOcean from $4 and Cloudways from $11 charge flat monthly rates. Kinsta starts at $35.
How much downtime does 99.9% uptime allow?
8 hours and 45 minutes a year. 99.99% allows 52 minutes and 99.999% allows 5 minutes. Uptime Institute’s 2026 survey found 57% of operators say their last major outage cost more than $100,000 and 1 in 5 say more than $1 million. The often-quoted $5,600 per minute figure is a 2014 Gartner blog estimate for enterprises, not websites.
How many DDoS attacks happen per year?
Cloudflare mitigated 47.1 million DDoS attacks in 2025, up 121% on 2024, about 5,376 an hour, including a record 31.4 terabits per second attack. In the first half of 2026 it mitigated 23.2 million network-layer attacks and 935 that exceeded 1 terabit per second. Human visitors made up only 47% of HTML requests on its network by December 2025; bots accounted for the rest.
Final Remarks
The story in this data is not that hosting got cheaper or faster. It is that the word stopped meaning one thing. Three-quarters of a trillion dollars of capital is building GPU clusters under the same label that covers a $2.99 shared plan, and the statistics for the 2 have almost nothing to do with each other except that the first is now raising the price of the second.
For anyone choosing a host, the useful numbers are small and specific. The renewal price, not the headline. The time to first byte, which is the only speed metric your host fully owns. Whether there is a CDN in front, because that decides your protocol and half your security. And the 5-hour window between a WordPress vulnerability going public and its mass exploitation, which most plans leave open.
The web is 1.49 billion sites and 217 million of them are alive. Decide which group yours is going to be in, and buy hosting for that one.
Tell Google you want more of this.
Add Gatilab as a preferred sourceOne tap, and this site shows up more often in your own Top Stories, AI Overviews and AI Mode. Remove it any time.