
Net Revenue Retention: The SaaS Metric That Predicts Growth
Net Revenue Retention might be the most important metric for SaaS companies that investors and operators rarely discuss publicly. It tells you whether your existing customers are worth more or less over time. A company with 120% NRR can grow significantly even without acquiring a single new customer. A company with 80% NRR is fighting against a constant drain that no amount of acquisition spending can fix.
SaaS metrics must be read together. NRR shows what happened to recurring revenue from the starting customer cohort; it does not explain acquisition, cash flow, margin, or concentration by itself.
What Is Net Revenue Retention?
Net Revenue Retention (NRR) measures the revenue from your existing customer base over time, accounting for expansions, contractions, and churn. It answers a simple question: If you stopped acquiring new customers today, would your revenue grow or shrink?
That’s it. One metric that tells you whether you’re building on solid ground or on sand.
The formula is central to SaaS marketing and growth planning:
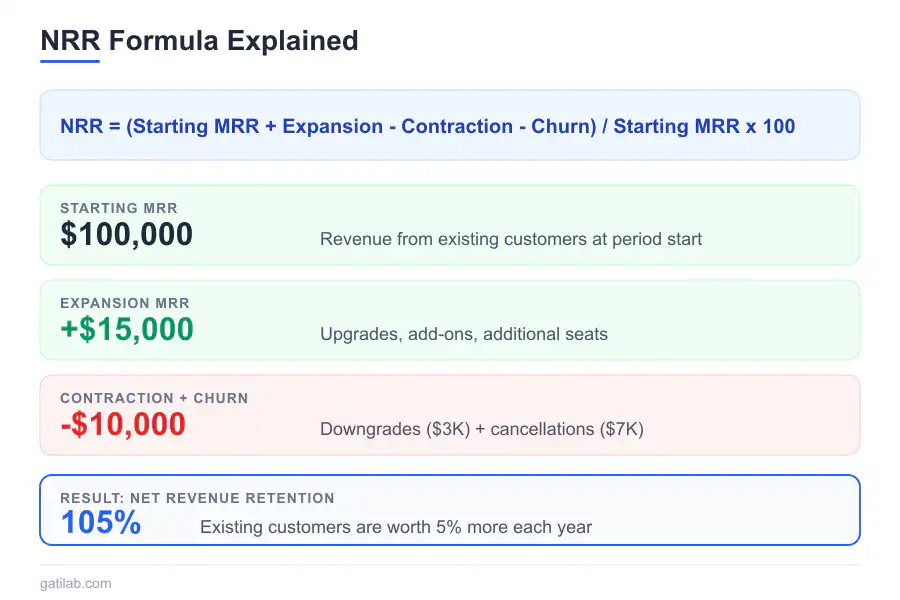
NRR = (Starting MRR + Expansion – Contraction – Churn) / Starting MRR x 100
Let me break down each component.
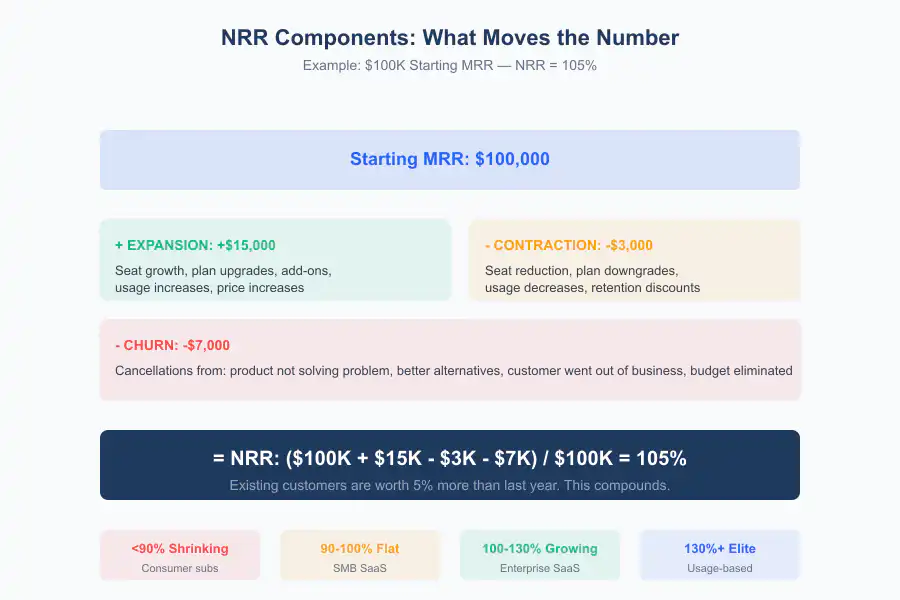
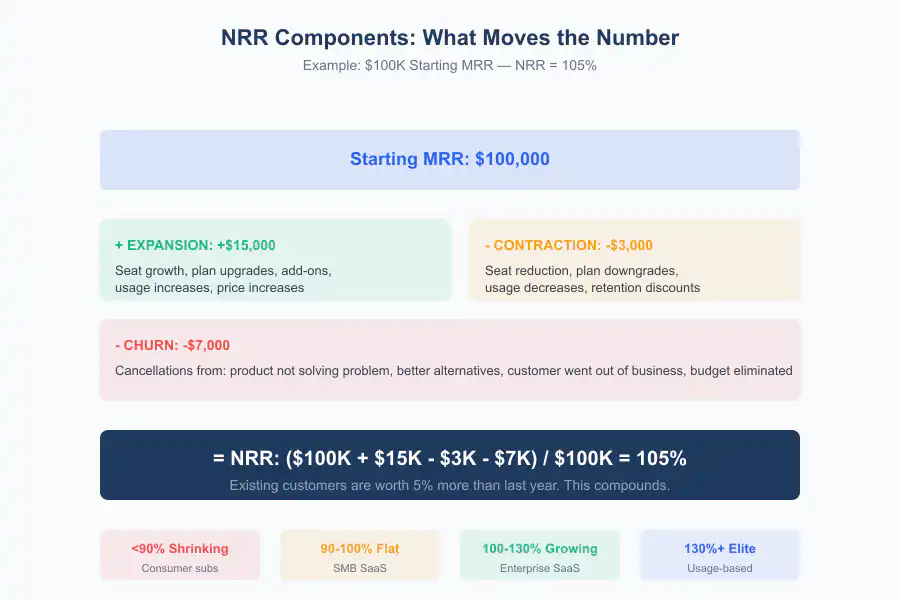
Starting MRR is your monthly recurring revenue from existing customers at the beginning of the period. This is your baseline.
Expansion MRR is additional revenue from those same existing customers. Upgrades, add-ons, additional seats, or increased usage. This is the good stuff.
Contraction MRR is lost revenue from downgrades. Customers still paying, but less than before. They haven’t left, but they’ve pulled back.
Churned MRR is revenue lost from customers who cancelled entirely. Gone.
Here’s a concrete example. If you started with $100,000 MRR, gained $15,000 from expansions, lost $3,000 from downgrades, and lost $7,000 from cancellations, your NRR is:
($100,000 + $15,000 – $3,000 – $7,000) / $100,000 x 100 = 105%
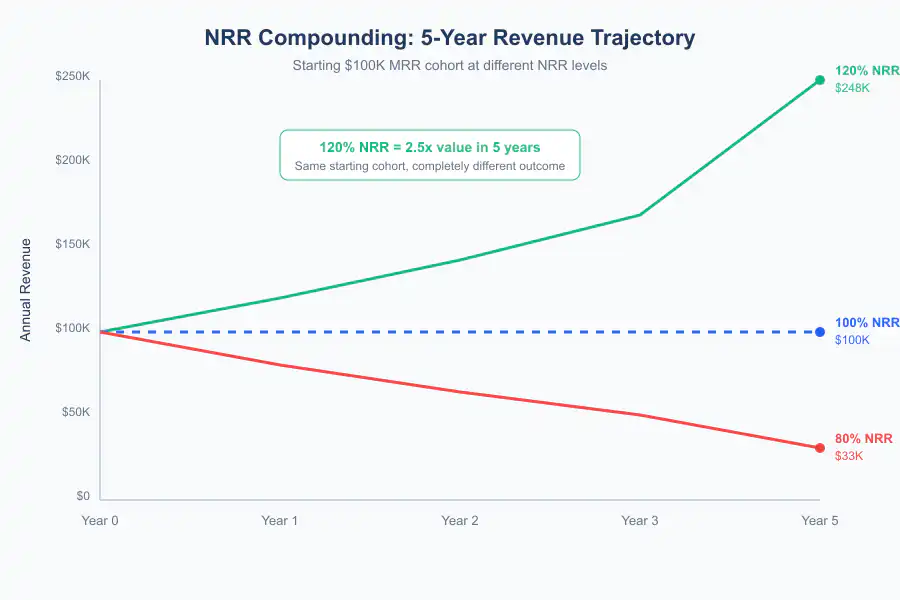
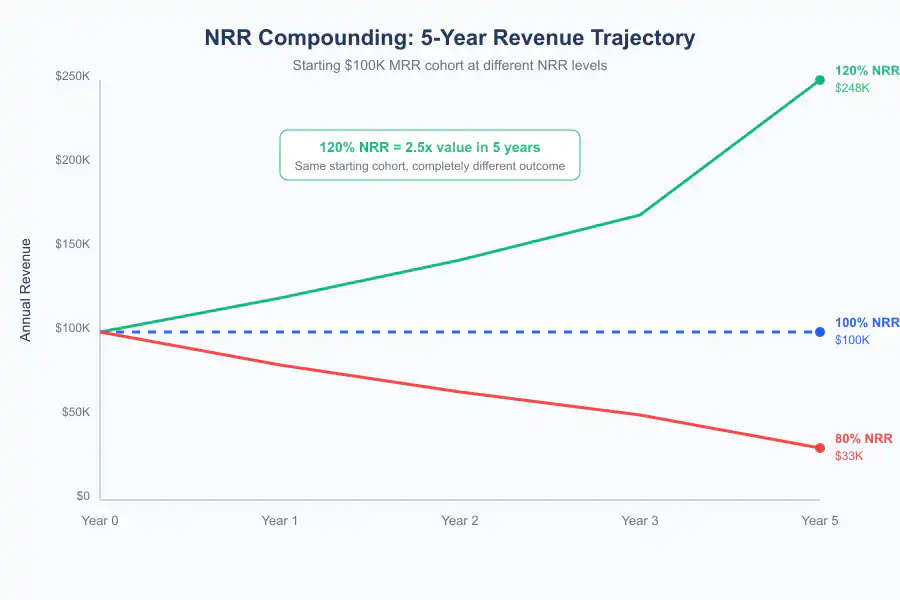
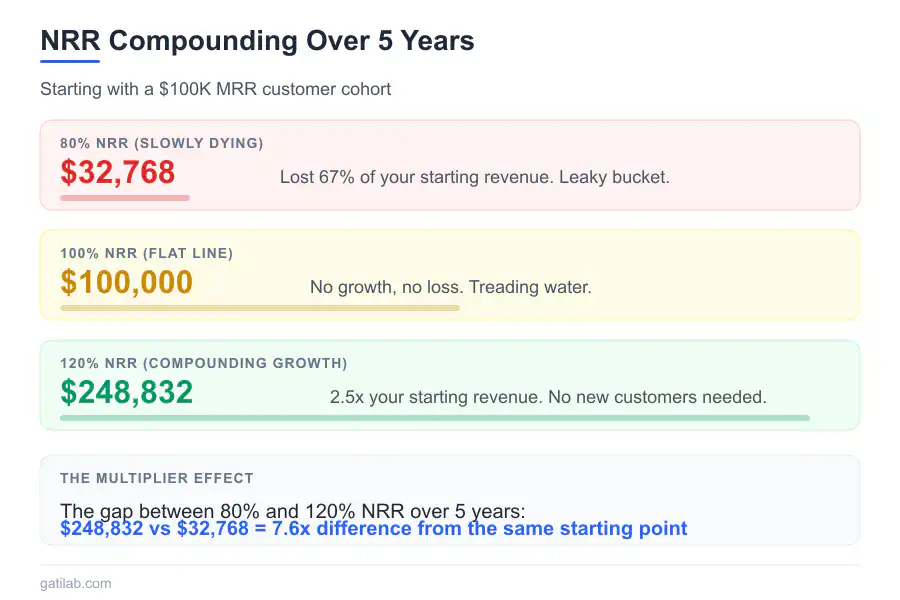
Your existing customers are worth 5% more than they were a year ago. That 5% compounds. Over five years, it transforms your revenue trajectory completely.
Why Net Revenue Retention Matters
NRR shows whether expansion from the starting customer cohort offsets contraction and churn. It changes how much new acquisition is needed to maintain or grow recurring revenue.
| Starting ARR | Expansion | Contraction | Churn | Ending cohort ARR | NRR |
|---|---|---|---|---|---|
| $1,000,000 | $150,000 | $30,000 | $70,000 | $1,050,000 | 105% |
| $1,000,000 | $40,000 | $50,000 | $100,000 | $890,000 | 89% |
Both synthetic companies can still grow total revenue after adding new customers. NRR isolates the starting cohort so acquisition does not hide retention loss.
NRR vs Other Retention Metrics
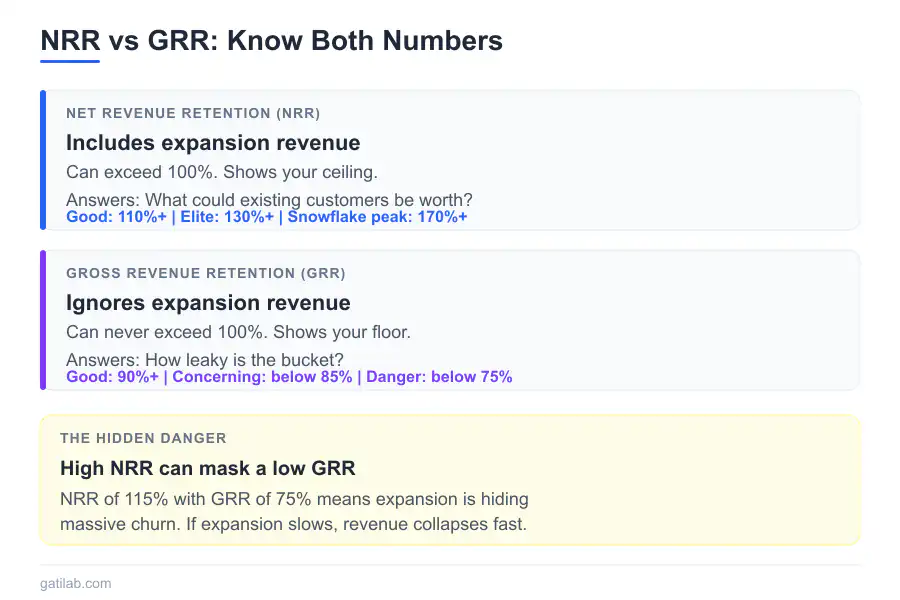
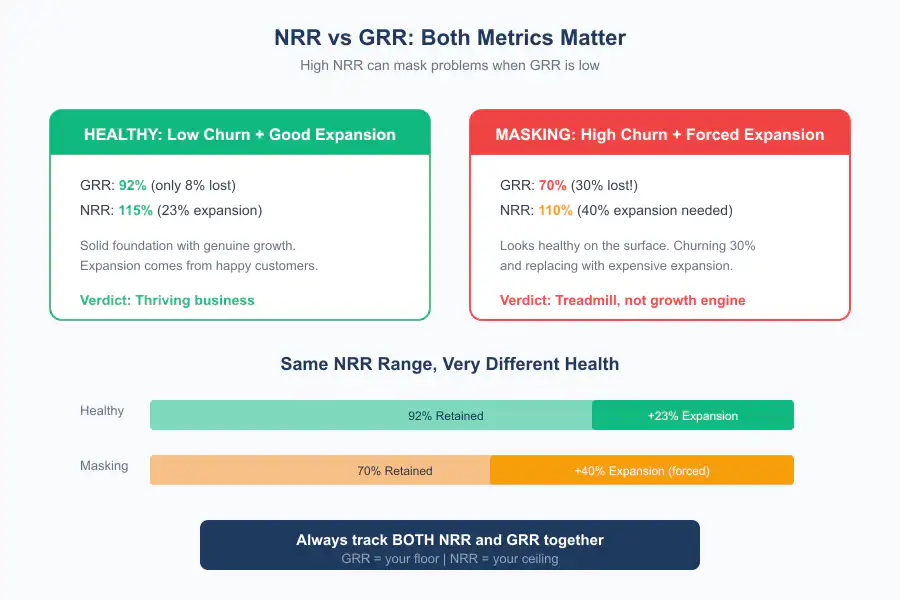
Gross Revenue Retention (GRR) ignores expansion. It only measures how much of your starting revenue you kept:
GRR = (Starting MRR – Contraction – Churn) / Starting MRR x 100
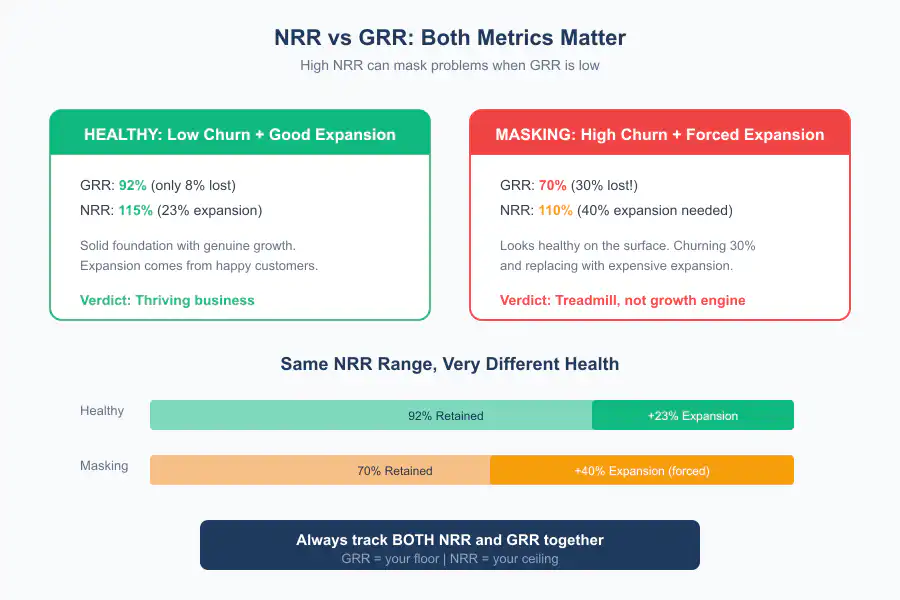
GRR cannot exceed 100% because expansion is excluded. Read GRR and NRR together: GRR exposes retained revenue before expansion, while NRR shows whether expansion offsets contraction and churn.
Logo Retention (Customer Retention) counts customers, not revenue:
Logo Retention = (Starting Customers – Churned Customers) / Starting Customers x 100
A synthetic company can have 90% logo retention but 80% revenue retention when larger customers churn. Another can have 80% logo retention but 110% NRR when the remaining cohort expands. The difference is why logo and revenue retention should not be substituted for each other.
Dollar Retention is often used interchangeably with NRR. Some companies calculate it slightly differently, but the concept is the same.
Net Revenue Retention Benchmarks
NRR benchmarks move with company size, customer segment, pricing model, and funding profile. Keep the cohort beside the rate.
| Dataset | Cohort | Median NRR | Additional context |
|---|---|---|---|
| Benchmarkit 2025 | 583 private B2B SaaS participants; 2024 data | 101% | Expansion ARR represented 40% of total new ARR |
| SaaS Capital 2026 | Bootstrapped private B2B SaaS with $3M-$20M ARR | 103% | 90th percentile NRR was 117.9%; median GRR was 91% |
Read the Benchmarkit findings and SaaS Capital cohort as reference distributions. A 103% NRR can hide weak new-customer growth, while a lower NRR may be acceptable in a low-price self-serve model with efficient acquisition.
The Components of NRR
Expansion revenue drives NRR above 100%. Sources include seat expansion when customers hire more people, plan upgrades when they move to higher tiers, add-on purchases for additional products, usage increases for usage-based pricing, and price increases that get passed through successfully.
The best expansion comes from genuine value delivery. Customers use your product more because it works. Forced upgrades through feature gating can work short-term but often creates resentment. I’ve seen companies gate features aggressively and then wonder why their NPS scores crater. The expansion revenue looked great for two quarters. The churn caught up by quarter four.
Contraction reduces NRR but keeps customers. It comes from seat reduction during layoffs or reorganization, plan downgrades from budget cuts or reduced needs, usage decreases during business slowdowns, and discounts offered to prevent churn.
Some contraction is inevitable. Economic downturns cause widespread seat reductions, and there’s nothing you can do about a customer’s budget getting cut. The goal is minimizing voluntary contractions where customers reduce usage because of dissatisfaction. That part is in your control.
Churn eliminates revenue entirely. Causes include the product not solving the problem, better alternatives existing, the customer going out of business, budgets being eliminated entirely, and poor customer experience.
Churn is the enemy. Even small churn rates compound into massive revenue loss over time. A 5% monthly churn rate means you lose over 46% of your customer base annually. The math is brutal.
Improve Expansion Revenue
- Tie seat, usage, or tier growth to value the customer can verify.
- Separate price increases from increased adoption in the expansion bridge.
- Track expansion by cohort, segment, plan, and customer age.
- Measure future contraction and churn after an upgrade.
- Do not force expansion through packaging that creates avoidable support cost or churn.
Reduce Churn and Contraction
Split lost recurring revenue into logo churn, seat or usage contraction, discounts, payment failure, product removal, and currency effects. Each mechanism needs a different response.
Segment by acquisition source, activation, customer age, plan, contract, usage, support history, and cancellation reason. A blended NRR can hide a strong enterprise cohort and a failing self-serve cohort.
Calculating and Tracking NRR
Choose and label the measurement period. Monthly NRR moves faster, quarterly NRR reduces some noise, and trailing-12-month NRR describes a longer cohort window. Do not compare them as the same series.
Define your cohort. Track NRR for customers who started in a specific period. This shows how retention changes over time and isolates the effect of different acquisition channels or product versions. Cohort analysis has shown me things aggregate numbers completely hid.
Separate segments. Calculate NRR by customer size, industry, acquisition source, and product. Overall NRR hides important variations. Your enterprise segment might have 130% NRR while SMB has 85%. Knowing that changes your strategy completely.
Build dashboards. Track NRR monthly alongside its components. Seeing expansion, contraction, and churn separately reveals what’s driving changes. A flat NRR number could mean stable business or could mean high expansion offsetting high churn. Very different situations.
Compare to CAC payback. If NRR is 120% and CAC payback is 12 months, every customer becomes profitable and then keeps growing. If NRR is 80% and CAC payback is 18 months, you’re losing money on most customers before they churn. The combination of these two metrics tells you more about business health than either one alone.
NRR in Company Disclosures
Public companies define retention differently. Record the metric name, beginning cohort, customer threshold, period, currency treatment, acquisitions, and whether the disclosure is rounded or presented as a range.
Do not turn one company’s disclosed NRR into an industry average or compare it with logo retention, GRR, or a private-company survey without showing the definition difference.
Net Revenue Retention Mistakes
- Adding revenue from customers acquired after the cohort start.
- Changing the customer threshold between periods.
- Mixing GRR, logo retention, and NRR.
- Ignoring contraction, discounts, refunds, or currency treatment.
- Comparing monthly, quarterly, and trailing-12-month rates as one series.
- Using a blended rate without segment, plan, or customer-age views.
Build Durable Net Revenue Retention
Start with customer fit and activation, then make continued value visible. Expansion should follow genuine usage or outcomes, while contraction and churn should remain observable rather than hidden by new-customer growth.
Track the full revenue bridge for each cohort: starting recurring revenue, expansion, contraction, churn, and ending recurring revenue.
SaaS Metrics FAQ
Frequently Asked Questions
What is net revenue retention?
NRR is ending recurring revenue from the starting customer cohort after expansion, contraction, and churn, divided by starting recurring revenue. New-customer revenue is excluded.
What is the NRR formula?
NRR equals starting recurring revenue plus expansion minus contraction minus churn, divided by starting recurring revenue, multiplied by 100.
What is a current private SaaS NRR benchmark?
SaaS Capital’s 2026 bootstrapped B2B SaaS cohort with $3 million to $20 million ARR reported median NRR of 103%. Benchmarkit’s 2025 private B2B SaaS sample reported a 101% median. The cohorts differ.
Can NRR exceed 100%?
Yes. NRR exceeds 100% when expansion from the starting cohort is greater than contraction and churn.
What is the difference between NRR and GRR?
GRR excludes expansion and cannot exceed 100%. NRR includes expansion and can exceed 100%. Both use the starting customer revenue cohort.
Should public-company NRR be used as an industry average?
No. Company definitions, customer thresholds, periods, currencies, acquisitions, and product mixes differ. Preserve the filing definition beside the value.
Tell Google you want more of this.
Add Gatilab as a preferred sourceOne tap, and this site shows up more often in your own Top Stories, AI Overviews and AI Mode. Remove it any time.