Business Math: Real-World Problems Every Founder Solves Daily
“When will I ever use this?”
Every math teacher hears this question. And often, the honest answer is: you won’t. Factoring polynomials rarely appears in adult life.
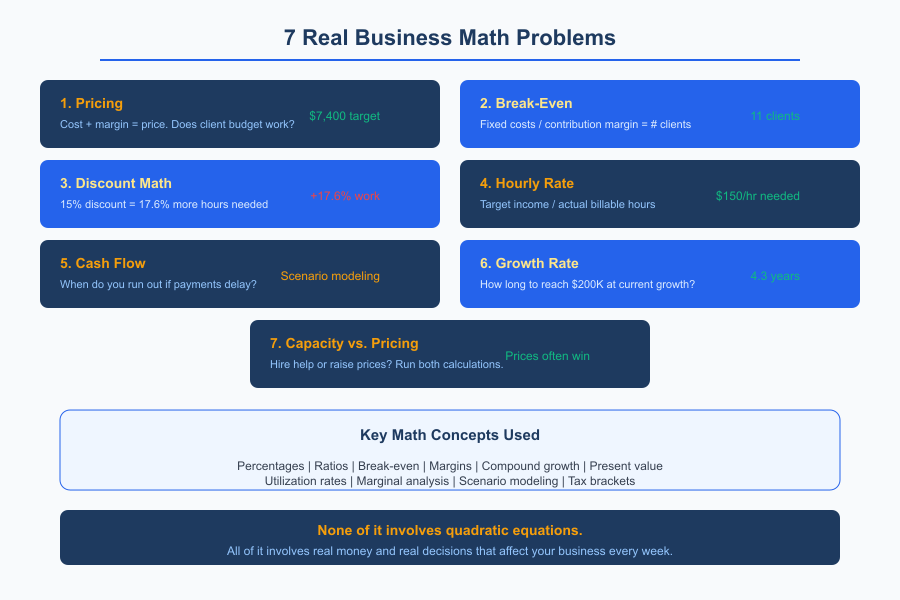
But the math that businesses use daily? That’s everywhere. Percentages. Ratios. Profit margins. Break-even points. Growth rates. I use more math running my business than I ever did in a classroom, and none of it involves quadratic equations.
I’ve run a business for 16 years. Here are the actual math problems I solve regularly, some of them weekly. Each one could replace a textbook problem with something real, something that affects actual money and actual decisions. Understanding these concepts is crucial for anyone learning how to price services as a freelancer or running any kind of business.
The Pricing Problem
I need to price a website project. My costs are known. My desired profit is known. But the client has a budget. Does the math work?
I use more math running my business than I ever did in a classroom, and none of it involves quadratic equations. Percentages, ratios, profit margins, break-even points. These show up in real decisions every week.
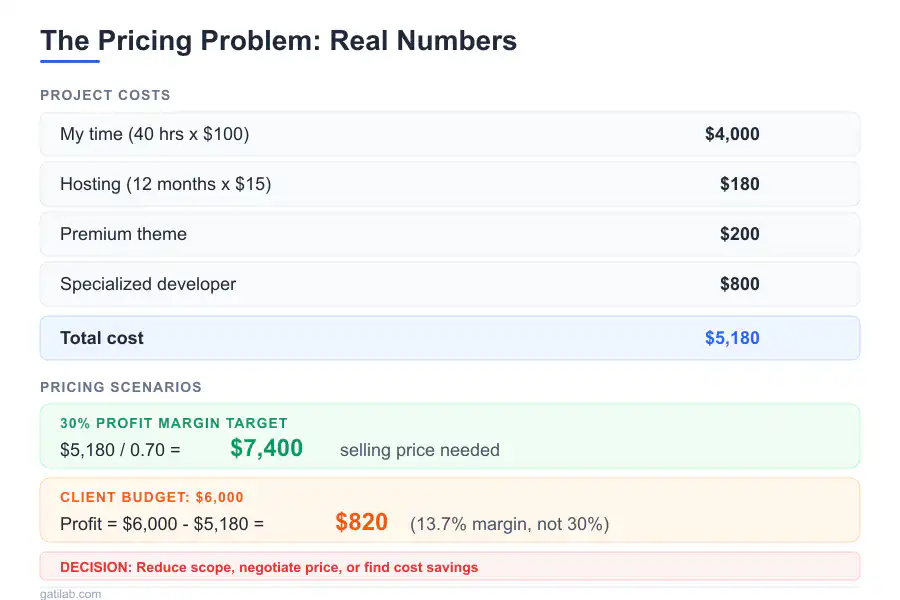
Here’s how it plays out. A project will take 40 hours of my time. I value my time at $100/hour. I also need to pay for hosting ($15/month for 12 months), a premium theme ($200), and a developer for specialized work ($800).
My time: 40 x $100 = $4,000 Hosting: 12 x $15 = $180 Theme: $200 Developer: $800 Total cost: $5,180
For a 30% profit margin, my cost represents 70% of the selling price. So $5,180 = 0.70 x Price, which means Price = $5,180 / 0.70 = $7,400.
But the client’s budget is $6,000. That means profit = $6,000 – $5,180 = $820, for a margin of 13.7%.
The budget works, but not at my target margin. I need to reduce hours, negotiate scope, or find cost savings. I face this exact calculation on nearly every project. The numbers change but the math is identical.
What’s at play here: percentages, profit margin calculation, cost aggregation, and target pricing. All of it learnable by middle school students. All of it used by every business owner I know.
The Break-Even Problem
I’m considering a new service with monthly overhead costs. How many clients do I need before it becomes profitable? This was the exact question I asked myself before launching my WordPress maintenance plans.
The fixed monthly costs: software tools ($200), part-time contractor ($500), my management time valued at $400. Total fixed: $1,100/month.
Each maintenance plan sells for $150/month with variable costs of $50 per client for hosting and support tickets. That gives a contribution margin of $100 per client.
Break-even: $1,100 / $100 = 11 clients.
At 25 clients, the math becomes interesting. Revenue hits $3,750, variable costs are $1,250, contribution is $2,500, minus $1,100 fixed costs, leaving $1,400/month profit.
I remember staring at this calculation when I was deciding whether to launch the service. Eleven clients felt achievable. And once I passed 11, every additional client added $100 of pure profit. The service now generates consistent monthly income that I can count on. These concepts apply directly to anyone building a retainer-based business.
What’s at play: fixed versus variable costs, unit economics, break-even analysis, contribution margin.
The Discount Dilemma
A client wants a discount. I need to understand how volume would need to change to maintain profitability. This conversation happens at least once a month.

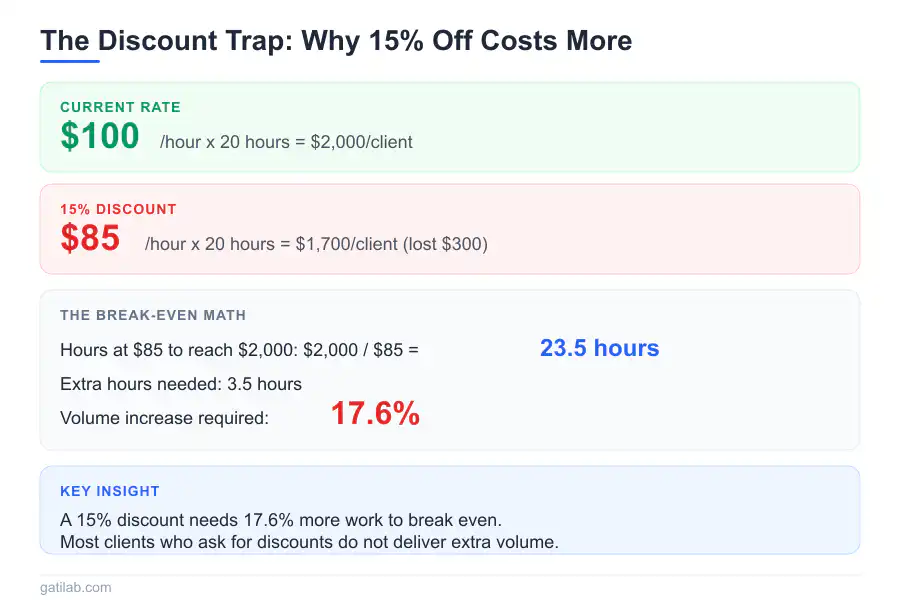
My standard rate is $100/hour with an average of 20 billable hours per client. A potential client wants 15% off but promises more work.
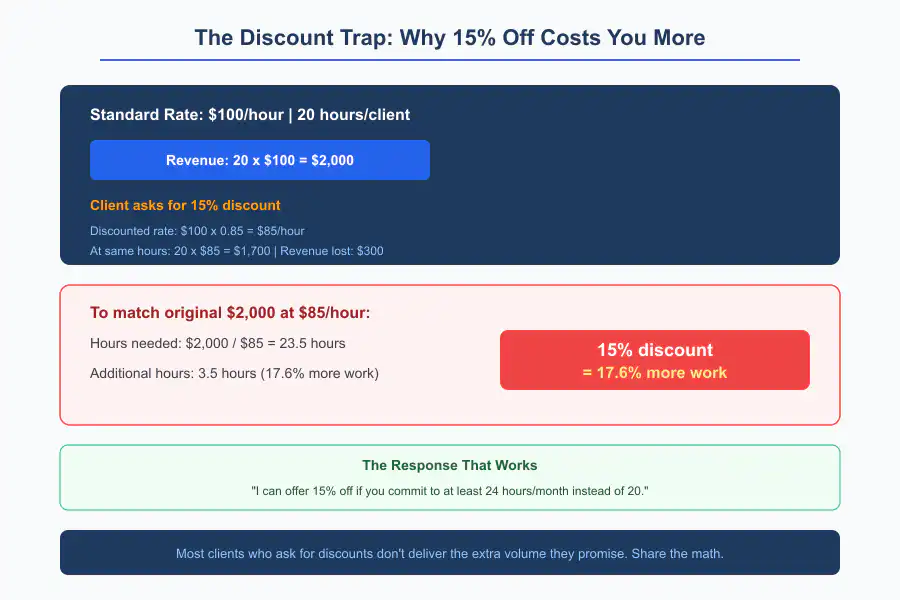
Current revenue per client: 20 hours x $100 = $2,000.
Discounted rate: $100 x 0.85 = $85/hour. Revenue at same hours: 20 x $85 = $1,700. Revenue lost: $300.
Hours needed at $85 to reach $2,000: $2,000 / $85 = 23.5 hours. Additional hours needed: 3.5 hours. Percentage increase required: 3.5 / 20 = 17.6%.
This is the insight that changed how I handle discount requests. A 15% discount requires 17.6% more hours to compensate. The client would need to provide almost 18% more work just for me to break even. Most clients who ask for discounts don’t actually deliver the extra volume they promise. Now I know the math, and I share it with the client directly. “I can offer 15% off if you commit to at least 24 hours per month instead of 20.” Most people respect the transparency.
What’s at play: percentage discounts, price-volume tradeoffs, proportional reasoning.
The Hourly Rate Reverse-Engineer
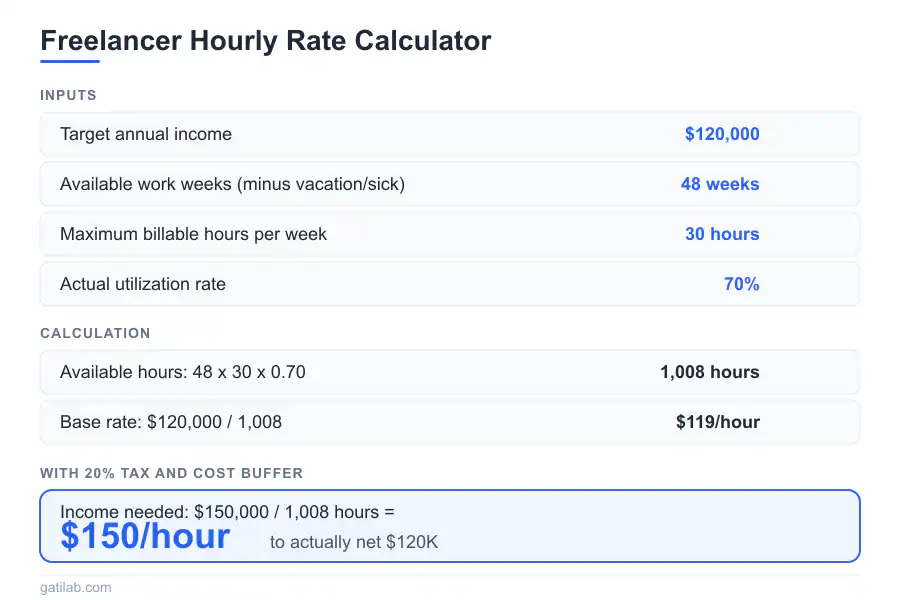
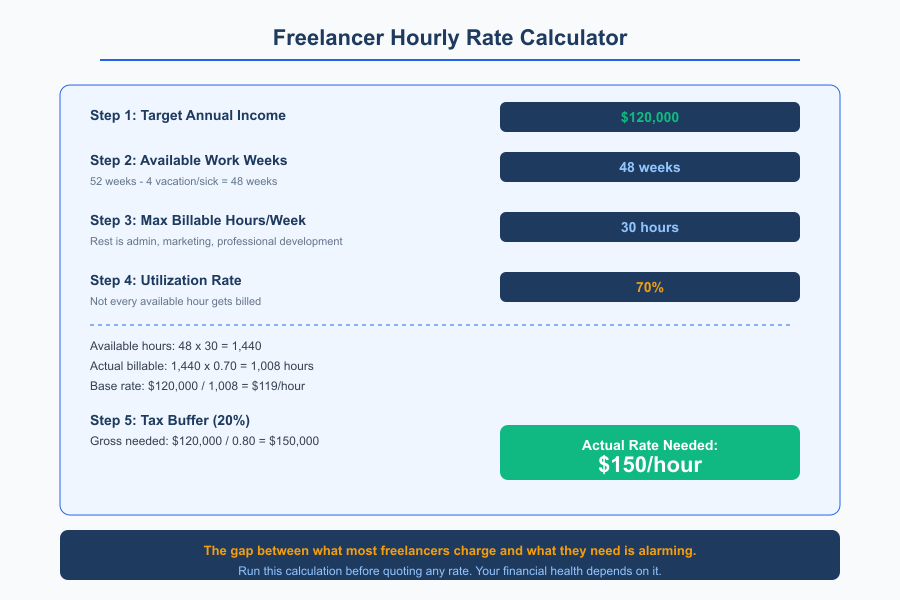
I want to earn a specific annual income. What hourly rate supports that goal? This is the calculation every freelancer should do before quoting any rate.
Target annual income: $120,000. Available work weeks: 48 (accounting for vacation and sick time). Maximum billable hours per week: 30 (the rest is admin, marketing, and professional development). Actual utilization: 70% (not every available hour gets billed).
Available hours: 48 weeks x 30 hours = 1,440 hours. Actual billable at 70%: 1,440 x 0.70 = 1,008 hours. Base rate: $120,000 / 1,008 = $119.05/hour.
With a 20% buffer for taxes and unexpected costs: Income needed: $120,000 / 0.80 = $150,000. Rate needed: $150,000 / 1,008 = $148.81/hour.
So I need to charge roughly $150/hour to actually net $120,000 after accounting for unbillable time and taxes. When I first did this calculation years ago, the gap between what I was charging and what I needed to charge was alarming. That alarm drove my first significant rate increase. See our guide on value-based pricing for more on moving beyond hourly rate thinking entirely.
What’s at play: reverse calculation, utilization rates, tax planning, annual-to-hourly conversion.
The Cash Flow Timing Problem
Revenue is uneven. Expenses are constant. When will I run out of cash if a big client delays payment? This problem has kept me up at night more than once.

Monthly expenses: $8,000. Current cash: $25,000. Expected revenue: Month 1 is $12,000, Month 2 is $5,000, Month 3 is $15,000.
Scenario A, all payments on time: Month 1: $25,000 + $12,000 – $8,000 = $29,000 Month 2: $29,000 + $5,000 – $8,000 = $26,000 Month 3: $26,000 + $15,000 – $8,000 = $33,000
Scenario B, Month 1 payment delayed to Month 3: Month 1: $25,000 + $0 – $8,000 = $17,000 Month 2: $17,000 + $5,000 – $8,000 = $14,000 Month 3: $14,000 + $15,000 + $12,000 – $8,000 = $33,000
Both scenarios end at $33,000. But Scenario B dips to $14,000, which might be dangerously low depending on your comfort level and any unexpected expenses.
I run this model every month now. It takes 10 minutes and prevents cash flow surprises. The one time I didn’t do it, I nearly missed a contractor payment because a client was 45 days late on a large invoice. Tracking these financial KPIs helps prevent exactly that kind of crisis.
What’s at play: cash flow modeling, running totals, scenario analysis.
The Growth Rate Reality Check
My revenue grew from $80,000 to $95,000 this year. Is that good growth? At this rate, when do I hit $200,000?
Growth rate: ($95,000 – $80,000) / $80,000 = 18.75%.
Years to $200,000 at this rate: $200,000 = $95,000 x (1.1875)^n 2.105 = 1.1875^n n = log(2.105) / log(1.1875) = 4.32 years
Required rate to reach $200,000 in 3 years: $200,000 = $95,000 x (1 + r)^3 1 + r = 2.105^(1/3) = 1.281 r = 28.1%
So I need 28% annual growth to reach $200,000 in 3 years, compared to my current 18.75%. That’s a significant acceleration. When I first ran this calculation for my own business, it forced me to be honest about whether my growth goals were realistic given my current trajectory. Sometimes the math tells you to adjust the timeline rather than the target.
What’s at play: percentage growth, compound growth, logarithms, goal-based calculations.
The Capacity Problem
I have more demand than capacity. Should I raise prices, hire help, or turn away work? This is a good problem to have, and the math helps you make the right call.

Current state: 25 clients at $200/month = $5,000/month. Capacity is 30 clients maximum. Waiting list has 10 potential clients. Hiring help costs $2,000/month but adds capacity for 15 clients.
Filling capacity without help (30 clients): 30 x $200 = $6,000/month.
With help (35 clients): Revenue: 35 x $200 = $7,000 Cost: $2,000 Net: $5,000/month. Same as current.
Wait. Hiring at these numbers nets me the same income while adding significant management complexity? That was a surprise when I first calculated it. The math said raising prices was the better path.
Price increase to match capacity: If a 10% price increase reduces demand by about 5 clients (from 35 interested to 30), then at $220 per month with approximately 30 clients, revenue becomes $6,600/month.
Raising prices generates more revenue than hiring at these specific numbers, with less complexity. The math doesn’t always point in this direction, but it did for me at that stage. Run your own numbers.
What’s at play: capacity constraints, marginal analysis, price elasticity, hiring decisions.
The Project Comparison Problem
Two potential projects. Different sizes, different timelines, different payment structures. Which is actually better?
Project A: $15,000 total, 3 months, payment on completion. Project B: $12,000 total, 2 months, 50% upfront. Both require the same total hours (150).
Hourly rates: A is $100/hour, B is $80/hour.
Monthly revenue: A delivers $5,000/month but all received in month 3. B delivers $6,000 upfront and $6,000 at end of month 2.
Time value adjusted (assuming 1% monthly opportunity cost): Project A: $15,000 received month 3, present value = $15,000 / (1.01)^3 = $14,559. Project B: $6,000 now + $6,000 in month 2, present value = $6,000 + $6,000/(1.01)^2 = $11,881.
A is still better even after time value adjustment, but the gap narrowed from $3,000 to $2,678. And B frees me up a month earlier to take on new work. Sometimes the “worse” project on paper is the better strategic choice. I’ve learned to consider all the variables, not just the top-line number.
What’s at play: rate comparison, time value of money, present value, project evaluation.
The Tax Threshold Problem
Tax rates change at certain income levels. Understanding the thresholds helps you make smarter decisions about taking on additional work near the end of a fiscal year.
With simplified brackets: 0 to $50,000 at 15%, $50,001 to $100,000 at 25%, over $100,000 at 35%.
Current income: $95,000. Potential project: $10,000.
Current tax: $50,000 x 0.15 ($7,500) + $45,000 x 0.25 ($11,250) = $18,750.
With additional $10,000: $7,500 + $50,000 x 0.25 ($12,500) + $5,000 x 0.35 ($1,750) = $21,750.
Additional tax on the project: $3,000. Effective marginal rate: 30%. Net from the project: $7,000.
The project crosses two brackets, with $5,000 taxed at 25% and $5,000 at 35%. Understanding this doesn’t mean you should avoid earning more. It means you should understand what you’ll actually keep. That $10,000 project nets $7,000. It’s still worth doing. But pricing future projects knowing your effective rate is 30% rather than 25% matters for profitability.
What’s at play: progressive taxation, marginal versus average rates, threshold effects.
Making These Problems Practical
Each problem above contains multiple mathematical concepts applied together. Here’s what I’ve noticed after solving these for 16 years.
A 15% discount requires 17.6% more hours to compensate. Most clients who ask for discounts don’t deliver the extra volume they promise. Now I share the math directly: “I can offer 15% off if you commit to at least 24 hours per month instead of 20.” Most people respect the transparency.
Estimation is underrated. Before calculating, develop a rough sense of the answer. “Break-even is probably between 10 and 20 clients.” This builds number sense that helps you spot errors and make faster decisions in conversations with clients.
Assumptions matter more than precision. Every calculation has assumptions. What if utilization drops to 60%? What if the client delays payment further? What if costs increase? Playing with assumptions shows how sensitive your decisions are to changing conditions. I’ve made better decisions from rough calculations with varied assumptions than from precise calculations with fixed assumptions.
And good accounting software automates much of this calculation, but understanding the underlying math ensures you’re interpreting the numbers correctly. Software gives you answers. Understanding gives you wisdom.
Business math is applied math. It answers questions people actually need answered. That makes it worth learning, worth teaching, and worth practicing regularly.
Business Math FAQ
Frequently Asked Questions
What math do you actually use running a business daily?
Percentages for profit margins, discounts, and growth rates. Break-even analysis with fixed versus variable costs. Pricing calculations including cost-plus and value-based approaches. Cash flow modeling for timing of payments and expenses. Capacity planning with utilization rates and hiring decisions. Tax calculations with marginal rates and thresholds. None of it involves quadratic equations. All of it involves real money and real decisions that affect your business every week.
How do I calculate break-even for a service business?
Add up fixed monthly costs like software, overhead, and base staff. Calculate contribution margin per client by subtracting variable costs from the price. Divide fixed costs by contribution margin. For example, $1,100 in fixed costs divided by $100 contribution per client equals 11 clients to break even. Every client beyond 11 adds $100 directly to profit. This calculation alone helped me decide whether to launch my maintenance plan service.
How should freelancers calculate their actual hourly rate?
Start with target annual income. Subtract weeks off for vacation and sick time, leaving roughly 48 work weeks. Multiply by maximum billable hours per week, usually 30 since the rest goes to admin and marketing. Apply a utilization rate of 60-80% because not every available hour gets billed. Add a 20% buffer for taxes. Example: $120,000 target divided by 1,008 actual billable hours equals $119 per hour, but you need approximately $150 per hour after accounting for taxes and unbillable time.
Why does a 15% discount require more than 15% extra work to compensate?
When you discount 15%, you keep 85% of your original rate. To earn the same total at 85% of your rate, you need the original amount divided by 0.85, which equals 117.6% of original hours. That is 17.6% more hours, not 15%. The percentage discount and percentage extra work are calculated on different bases. This insight changed how I handle discount requests. I now share the math directly with clients and tie discounts to volume commitments.
How do I model cash flow to avoid running out of money?
Create a simple monthly model: starting cash plus expected revenue minus expenses equals ending cash. Run two scenarios: all payments on time and a major payment delayed by 60 days. Both scenarios may end at the same place but the delayed-payment scenario might dip dangerously low in month two. Run this model every month, it takes 10 minutes, and it prevents cash flow surprises that can threaten your business.
How do I calculate growth rate and time to reach revenue goals?
Growth rate equals the difference between current and previous revenue divided by previous revenue. To find years to a target, use logarithms: years equals log of target divided by current, divided by log of 1 plus growth rate. For example, growing from $95K to $200K at 18.75% growth takes 4.3 years. To reach $200K in 3 years would require 28.1% annual growth instead. This math forces honesty about whether your growth goals are realistic given current trajectory.
When should I raise prices versus hire help for capacity problems?
Run the numbers. With 25 clients at $200 per month earning $5,000, hiring help at $2,000 per month for 15 more clients means 35 clients at $7,000 minus $2,000 equals the same $5,000 with added management complexity. A 10% price increase to $220 with about 30 clients yields $6,600 with no extra complexity. Raising prices often generates more net revenue than hiring at smaller scales. Always calculate both paths before deciding.
How should I compare two project opportunities with different payment structures?
Compare hourly rates, monthly revenue timing, and present value. A $15,000 project paid on completion in 3 months has different value than a $12,000 project with 50% upfront paid in 2 months. Factor in time value of money at roughly 1% monthly opportunity cost. Also consider that the shorter project frees you up earlier for new work. Sometimes the project with a lower top-line number is the better strategic choice when you account for all variables.